The Three States of Information, in JAX
#ml#training-dynamics#representation-learning#neural-collapse#simplex-etf#contrastive#phase-transitions#jax#implementation
The explainer named three states a representation passes through while training (random, organized, structured) and argued the loss plateaus are the transitions between them. This is the implementation companion: four tiny JAX runs that measure each state directly. The spectrum’s effective rank falling from d toward C−1; the simplicity bias that fits a near-linear boundary before it wraps the moons; the class-mean cosines locking onto the Welch value −1/(C−1); and the contrastive loss splitting into two forces on two clocks. Each metric is an eigenvalue or a loss, nothing scripted.
Everything below is plain JAX on tiny synthetic data (a few hundred points, a two-layer MLP), so the training loop and the linear algebra both fit on screen. A shared step function does the work:
import jax, jax.numpy as jnp, optax

def make_step(loss_fn, opt):
    @jax.jit
    def step(p, st):
        g = jax.grad(loss_fn)(p)
        up, st = opt.update(g, st, p)        # adamw needs params for decoupled decay
        return optax.apply_updates(p, up), st
    return step
State as spectrum: effective rank falls toward C−1
The cleanest single number for “how structured is this representation” is the effective rank of the feature covariance, the participation ratio of its eigenvalues. At initialization the features are isotropic and the spectrum is flat, so the effective rank is near the full dimension d (the random state). As training squeezes out within-class variation, a few modes dominate and the rest are ground down; the spectrum collapses onto the C−1 directions that separate the classes (the structured state). Organized is the in-between, where a handful of modes have emerged but the tail has not yet vanished.
def feature_spectrum(Z):
    """Z: (N, d) features -> sorted eigenvalues of the feature covariance."""
    Zc = Z - Z.mean(0)
    cov = Zc.T @ Zc / Z.shape[0]
    ev = jnp.clip(jnp.linalg.eigvalsh(cov), 0.0, None)
    return jnp.sort(ev)[::-1]

def effective_rank(ev):
    return (ev.sum() ** 2) / (jnp.sum(ev ** 2) + 1e-12)   # participation ratio
Train a small classifier on C=5 Gaussian blobs with a d=12 feature layer and watch the effective rank fall from ~12 toward C−1 = 4:
ev0 = feature_spectrum(feats(params, X))
print("init effective rank:", float(effective_rank(ev0)))     # ~ 12 (isotropic)
# ... train ...
evT = feature_spectrum(feats(params, X))
print("final effective rank:", float(effective_rank(evT)))    # ~ 3.9 ≈ C-1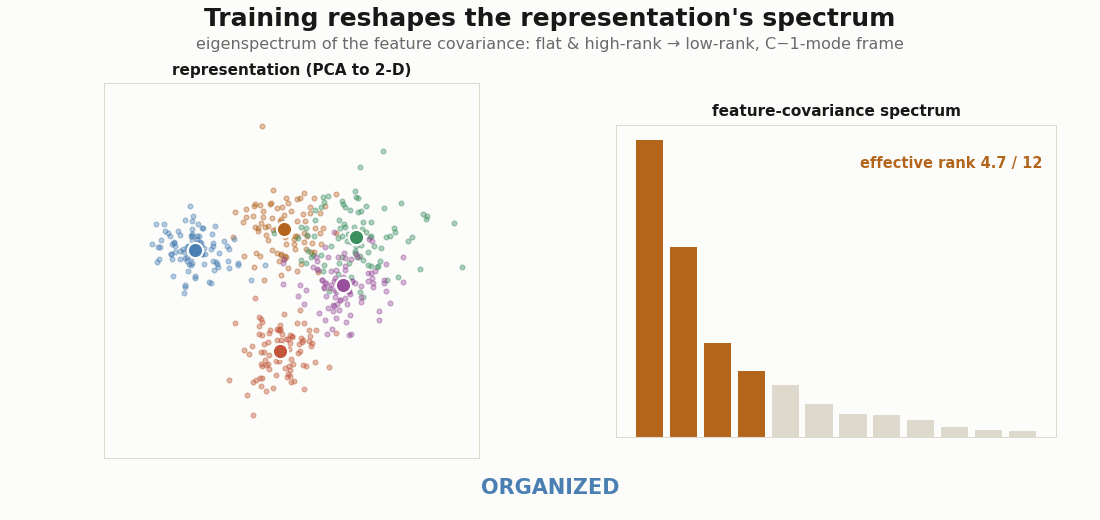
d=12 feature covariance. It starts flat and high-rank (RANDOM, effective rank ≈ 12), develops a few dominant modes (ORGANIZED), and collapses onto a C−1-mode frame (STRUCTURED, effective rank ≈ 3.9). The badge reads the state off the spectrum and a 2-D class-separation metric.Organized first: the simplicity bias
Why does organized come before structured? Because networks fit low-order structure first: the mean and covariance of the data before its higher-order correlations, the distributional simplicity bias documented from small CNNs to LLMs (Refinetti et al., 2023; Belrose et al., 2024). On two moons it is visible to the eye: the decision boundary starts nearly linear (the coarse, low-order split) and only gradually grows the curvature needed to wrap the moons.
from sklearn.datasets import make_moons

Xn, yn = make_moons(320, noise=0.18, random_state=0)
Xn = (Xn - Xn.mean(0)) / Xn.std(0)

def net(p, x):
    h = jax.nn.relu(x @ p["W1"] + p["b1"])
    h = jax.nn.relu(h @ p["W2"] + p["b2"])
    return h @ p["W3"] + p["b3"]

loss_fn = lambda p: optax.softmax_cross_entropy_with_integer_labels(
    net(p, X), y).mean()
A cheap proxy for boundary complexity is its length on a grid: count how often the argmax prediction flips between neighbouring cells. Accuracy saturates fast; that length keeps climbing well after, the signature of higher-order structure arriving late:
def boundary_complexity(p, grid, shape):
    pred = net(p, grid).argmax(-1).reshape(shape)
    flips = jnp.abs(jnp.diff(pred, axis=0)).sum() + jnp.abs(jnp.diff(pred, axis=1)).sum()
    return flips / shape[0]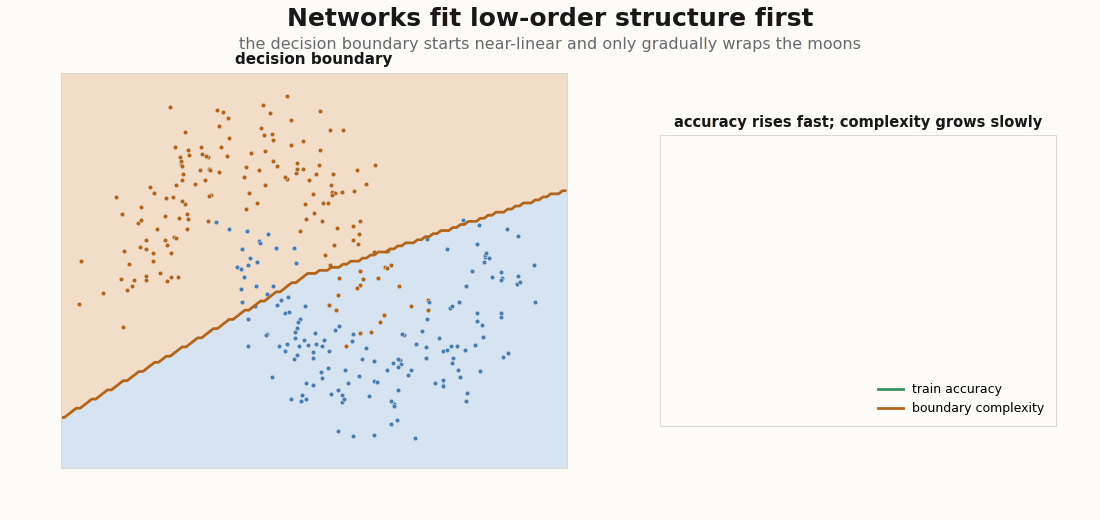
Structured: the simplex and the Welch value
The structured endpoint is not arbitrary. In the balanced classification limit the class means converge to a simplex equiangular tight frame: every pair of class-mean directions sits at the same angle, and that angle is the Welch bound value , the most-separated arrangement possible for C points on a sphere (Papyan, Han & Donoho, 2020; Welch, 1974). The diagnostic is the distribution of off-diagonal class-mean cosines: it should concentrate onto that single value.
def equiangularity(Z, y, C):
    """Off-diagonal cosines between (centered) class means; target is -1/(C-1)."""
    mu = jnp.stack([Z[y == c].mean(0) for c in range(C)])
    mu = mu - mu.mean(0)
    mun = mu / (jnp.linalg.norm(mu, axis=1, keepdims=True) + 1e-9)
    G = mun @ mun.T
    iu = jnp.triu_indices(C, 1)
    cosines = G[iu]
    return cosines, -1.0 / (C - 1)            # (off-diagonals, Welch target)

cos, target = equiangularity(feats(params, X), y, C)
print("mean cosine:", float(cos.mean()), " target -1/(C-1):", target)
print("equiangularity std:", float(cos.std()))   # -> 0 as the frame tightens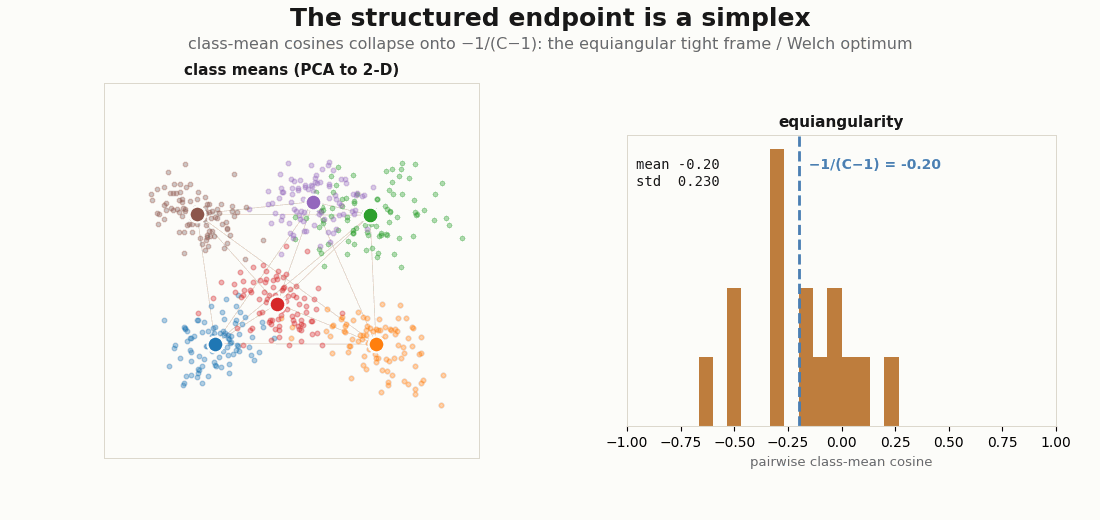
C=6 classifier’s class means (left, PCA to 2-D) settle into a simplex; the histogram of all pairwise class-mean cosines (right) tightens onto the Welch line −1/(C−1) = −0.20. As the frame becomes equiangular the spread (std) shrinks toward zero, the structured state made into a single converging number.Two clocks: alignment and uniformity
The supervised picture has a contrastive twin. Wang & Isola (2020) show the contrastive loss decomposes into alignment (positive pairs pulled together) and uniformity (features spread evenly over the sphere). The two are not optimized at the same speed, and watching them separately is the cleanest view of organized-then-structured. With strong augmentations the dynamics are striking: uniformity (the spread) resolves first, and while it spreads it flings positive pairs apart, so alignment shows an early hump before the second phase pulls positives back together.
def align_loss(za, zb):
    return jnp.sum((za - zb) ** 2, axis=1).mean()          # ‖f(x) − f(x⁺)‖²

def uniform_loss(z, t=2.0):
    d2 = jnp.sum((z[:, None, :] - z[None, :, :]) ** 2, -1)  # pairwise sq dist
    n = z.shape[0]
    mask = 1.0 - jnp.eye(n)
    mean_off = (jnp.exp(-t * d2) * mask).sum() / (n * (n - 1))
    return jnp.log(mean_off)                                # Wang–Isola uniformity

def contrastive_loss(p):
    za, zb = enc(p, A), enc(p, B)                           # two augmented views
    return align_loss(za, zb) + uniform_loss(jnp.concatenate([za, zb], 0))
The encoder ends z / ‖z‖, projecting onto the unit circle (a 2-D sphere) so the geometry is drawable:
def enc(p, x):
    h = jax.nn.relu(x @ p["W1"] + p["b1"])
    h = jax.nn.relu(h @ p["W2"] + p["b2"])
    z = h @ p["W3"] + p["b3"]
    return z / (jnp.linalg.norm(z, axis=1, keepdims=True) + 1e-8)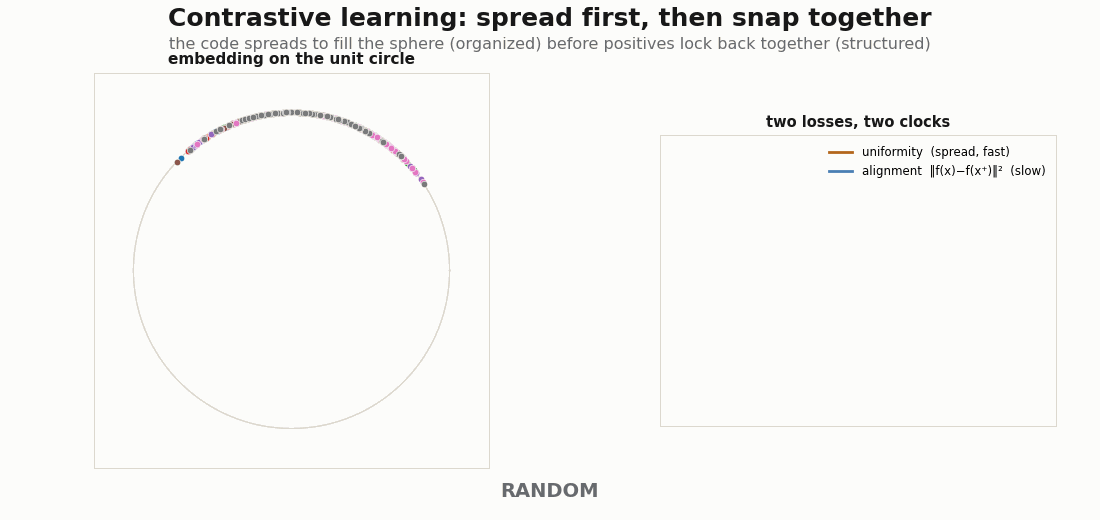
Rendering the GIFs
All four animations are generated with Python, JAX, and matplotlib, every metric (eigenspectrum, effective rank, equiangular cosines, alignment/uniformity losses) recomputed live each frame from the current parameters:
python scripts/render_ts_spectrum_states_gif.py   # spectrum: random -> structured, effective rank d -> C-1
python scripts/render_ts_simplicity_bias_gif.py   # two-moons boundary: low-order structure first
python scripts/render_ts_neural_collapse_gif.py   # class-mean cosines -> -1/(C-1), the simplex
python scripts/render_ts_align_uniform_gif.py     # contrastive: uniformity then alignment, two clocks
None is a benchmark; they are visual audits of the three states. The objects are deliberately tiny so the state is legible, but the metrics (participation ratio, equiangularity, alignment, uniformity) are exactly the probes the explainer recommends logging during a plateau on a real run.
The point
The explainer made the case in pictures and prose; this companion turns each state into a number you can watch fall or concentrate. Random is a flat, full-rank spectrum. Organized is low-order structure fit first: a near-linear boundary, positives loosely clustered. Structured is the C−1-mode frame, the equiangular simplex at −1/(C−1), the uniform-and-aligned sphere. Same three states, four different instruments, all live in JAX.
References: three-states framing and the contrastive split from Wang & Isola (2020); neural collapse from Papyan, Han & Donoho (2020); the simplicity bias from Refinetti et al. (2023) and Belrose et al. (2024); saddle-to-saddle dynamics from Saxe, McClelland & Ganguli (2013); the Welch bound from Welch (1974).
Cite as
Bouhsine, T. (). The Three States of Information, in JAX. Records of the !mmortal Data Scientist. https://tahabouhsine.com/blog/three-states-of-information-jax/
BibTeX
@misc{bouhsine2026threestatesofinformationjax,
  author       = {Bouhsine, Taha},
  title        = {The Three States of Information, in JAX},
  year         = {2026},
  month        = {jun},
  howpublished = {\url{https://tahabouhsine.com/blog/three-states-of-information-jax/}},
  note         = {Blog post, Records of the !mmortal Data Scientist}
}References
- (2013). Exact Solutions to the Nonlinear Dynamics of Learning in Deep Linear Neural Networks. ICLR 2014.arXiv:1312.6120
- (2020). Prevalence of Neural Collapse during the Terminal Phase of Deep Learning Training. PNAS 117(40).arXiv:2008.08186
- (2023). Neural Networks Trained with SGD Learn Distributions of Increasing Complexity. ICML 2023.arXiv:2211.11567
- (2024). Neural Networks Learn Statistics of Increasing Complexity. ICML 2024.arXiv:2402.04362
- (2020). Understanding Contrastive Representation Learning through Alignment and Uniformity on the Hypersphere. ICML 2020.arXiv:2005.10242
- (1974). Lower Bounds on the Maximum Cross Correlation of Signals. IEEE Transactions on Information Theory 20(3).doi:10.1109/TIT.1974.1055219