 JAX Pathways
Phase 21 / TPU Systems: Generations, Memory, Precision & XProf
bfloat16, int8 precision, and XProf profiling on TPU
Revision v0.7.0 · Updated since your last visit. Review the changes; your progress is saved.
Lesson · about 25 minutes · CPU practice
Measure bfloat16 and symmetric int8 matrix multiplication error against float32, verify float32 accumulator precision, and capture a warmed XProf (*.xplane.pb) trace.
Phase study guide: preparation, milestones and project evidence
Before you start
Before this: TPU generations and HBM memory budgeting
Hardware: CPU numerical & profiler harness; Cloud TPU VM for target XProf traces
Setup help: Python, notebook, or Cloud TPU VM
Use the tested CPU packages (the recorded environment uses Python 3.14.3). Other Python versions and accelerator environments require separate checks. The optional Cloud TPU specialization explains the target-specific execution boundaries. Logical CPU devices practice partitioning; they do not simulate TPU performance.
Download the repository ZIP or use your existing checkout. Extract it and open a terminal in the folder containing requirements-cpu.txt. The beginner ZIP is separate; these lessons use the full repository folder.
python3 -m venv .venv
source .venv/bin/activate
python -m pip install -r requirements-cpu.txtpy -3 -m venv .venv
.\.venv\Scripts\python.exe -m pip install -r requirements-cpu.txtAfter activation, run the complete worked example from that same folder:
python phases/21-tpu-systems/02-bfloat16-int8-precision-and-xprof-profiling/code/main.py.\.venv\Scripts\python.exe phases/21-tpu-systems/02-bfloat16-int8-precision-and-xprof-profiling/code/main.pyFor an incremental build, create main.py in your own practice folder, append each build block in order, and run python main.py with this environment active. Keep that file separate from the downloaded reference solution.
Download this lesson’s notebook. Open it with a Python kernel using the course environment. Run cells from the top after restarting the kernel; experiments depend on earlier definitions.
For local Jupyter, first install the course requirements using the Local Python steps, then use your environment’s Python to start Jupyter:
python -m pip install jupyterlab
python -m jupyter lab.\.venv\Scripts\python.exe -m pip install jupyterlab
.\.venv\Scripts\python.exe -m jupyter labSelect the downloaded tpu-06.ipynb file in JupyterLab. The notebook contains reference solutions; make your prediction and attempt each practice task before opening them. Restart the kernel before changing logical device setup.
The worked reference for this lesson is CPU-validated. Some references explicitly configure logical CPU devices; setting JAX_PLATFORMS does not adapt them to a TPU. Follow the execution matrix and reviewed multi-host example before attempting a target run.
For accelerator preparation, study TPU setup, observed runtime receipts, checkpointed jobs and precision and retained traces. These target paths remain unqualified on physical TPU hardware until an actual receipt is recorded. Cloud provisioning is optional for CPU learning.
Check: Prints the precision error table (showing lower error for fp32 accumulation than bf16 accumulation) and confirms that at least one *.xplane.pb trace file was captured.
Revisit the guided CPU setup · Open 19: TPU Setup. Package instructions are CPU instructions; Windows and accelerator environments need their own validation.
What you will be able to do
- Measure numerical error for
bfloat16matmuls withfloat32accumulation versusbfloat16accumulation. - Implement per-column INT8 weight quantization and an FP32 dequantization reference; account for scales and test a zero-valued channel.
- Capture a warmed
jax.profiler.trace(*.xplane.pb) on a Cloud TPU VM (or local CPU rehearsal) after synchronizing warmup. - Download the trace directory with
gcloud compute tpus tpu-vm scp --recurseand inspect it in TensorBoard / XProf.
The problem
Compare BF16 operand rounding and a per-column INT8 weight-quantization reference on CPU, while distinguishing stored values, dequantized operands, accumulation type, and device-kernel execution. Retain a trace of the actual worked workload in a user-selected directory so its events can be inspected.
The idea
This lesson measures numerical error for a BF16 matmul and an FP32 dequantization reference for INT8 weights. The INT8 path stores quantized weights plus scale metadata, then casts and rescales them to FP32 before the dot; it does not demonstrate a native INT8 kernel, packed runtime storage, or reduced device-memory traffic. The FP32 result is a finite-precision reference, not exact arithmetic. Keep the generated XProf directory after the example returns.
Why TPU matmuls use bfloat16 operands with float32 accumulation
BF16 has the same exponent width as FP32, but its shorter significand still rounds values; this does not eliminate all underflow, overflow, or accuracy problems. preferred_element_type=jnp.float32 requests a FP32 result/accumulation type through the JAX dot API, but a CPU run does not establish a TPU kernel’s internal implementation.
The INT8 example quantizes each output column using scale = max(abs(W[:, j])) / 127, stores one signed byte per weight plus one FP32 scale per column, and then dequantizes to FP32 before the dot. A zero column uses scale zero and must produce a zero quantized column without division by zero. This is a numerical reference only: it does not show a native INT8 dot, packed storage, activation quantization, or reduced device memory traffic. Compare against the FP32 JAX computation, which is finite precision. The measured error is specific to the fixed input and weight arrays.
1. Capture a warmed XProf trace on your Cloud TPU VM and inspect in TensorBoard
The worked CPU example warms the exact function it profiles and writes its trace under TPU_TRACE_DIR (default ./tpu-xprof-trace). The directory remains after the function returns. Open that directory in TensorBoard/XProf and inspect the actual event names, timestamp units, host dispatch, compilation boundary, device work, synchronization, and input stalls that are present in your trace. A CPU trace teaches event reading; it does not establish TPU performance. For timing comparisons, measure synchronized steps outside the profiler.
Run tpu-06.py and capture a 5-step warmed XProf trace on the Cloud TPU VM
gcloud compute tpus tpu-vm scp public/exercises/tpu-06.py "$TPU_NAME":~/jax-tpu-lab/ --zone="$ZONE"
gcloud compute tpus tpu-vm ssh "$TPU_NAME" --zone="$ZONE" --command="set -euo pipefail; source ~/jax-tpu-lab/.venv/bin/activate; export TPU_TRACE_DIR=~/jax-tpu-lab/tpu-xprof-trace; JAX_PLATFORMS=tpu python ~/jax-tpu-lab/tpu-06.py"
mkdir -p ./tpu-xprof-trace
gcloud compute tpus tpu-vm scp --recurse "$TPU_NAME":~/jax-tpu-lab/tpu-xprof-trace ./ --zone="$ZONE"
Expected:
Runs the lesson workload, captures that workload in the persistent TPU_TRACE_DIR, then copies the retained trace directory back. Inspect actual events in XProf; CPU and TPU traces remain separately identified.
Launch TensorBoard with the XProf profile plugin on your workstation
# Launch TensorBoard with the XProf profile plugin on your workstation
pip install tensorboard tensorboard-plugin-profile xprof
tensorboard --logdir ./tpu-xprof-trace --port 6006
Expected:
Serves the XProf Trace Viewer, Overview Page, and Memory Viewer at http://localhost:6006.
Measured numerical error for BF16 and an FP32 INT8 dequantization reference
Predict before looking: How do bf16 (fp32 accum), bf16 (bf16 accum), and int8 per-col (fp32 accum) compare in maximum and mean absolute error against an fp32 reference?
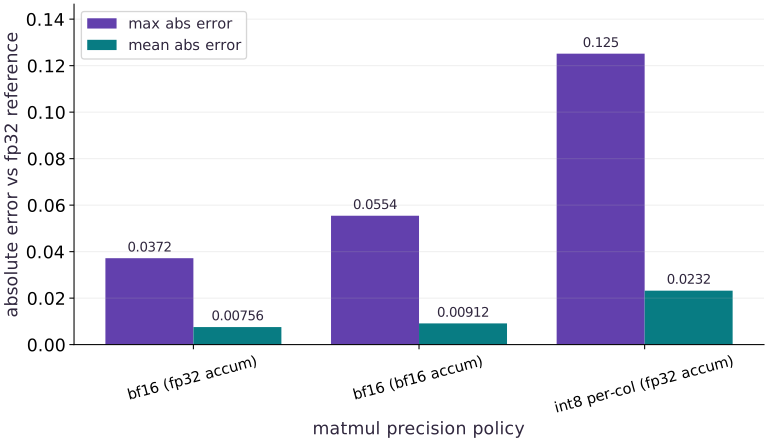
Read the figure
Errors are measured against the finite-precision FP32 JAX dot for this seeded input. The INT8 row quantizes weights, then dequantizes to FP32 before the dot; it is not a native INT8 kernel result.
Connect it to the computation
The measured INT8 error belongs to this fixed example. Its storage estimate must include one FP32 scale per output column, and this code does not demonstrate runtime memory traffic savings.
Open full-size figureDownload data and provenance
The notebook contains the data experiment, plotting code, and recorded figure output. Rerun it to test your changes.
Where to put & run this code: Work in phases/21-tpu-systems/02-bfloat16-int8-precision-and-xprof-profiling/code/main.py (or downloaded exercises/tpu-06.py / exercises/tpu-06.ipynb) and execute from the repository root with python3 phases/21-tpu-systems/02-bfloat16-int8-precision-and-xprof-profiling/code/main.py.
1 Compare BF16 (FP32 vs BF16 accumulation) and per-channel INT8 matmul errors
Create main.py with evaluate_precision_policies.
# Step 1 — Compare BF16 (FP32 vs BF16 accumulation) and per-channel INT8 matmul errors: Measuring both max and mean absolute error across accumulation...
# Import pathlib (Path) for this computation.
from pathlib import Path
import os
import tempfile
import time
import jax
import jax.numpy as jnp
import numpy as np


# Function `evaluate_precision_policies(seed)` implementing this stage's computation:
def evaluate_precision_policies(seed=0):
    # Create or split explicit PRNG key(s) (`(k1, k2)`) for reproducible randomness.
    k1, k2 = jax.random.split(jax.random.PRNGKey(seed))
    # Sample deterministic random values into `x` using an explicit PRNG key.
    x = jax.random.normal(k1, (64, 256), dtype=jnp.float32)
    # Sample deterministic random values into `w` using an explicit PRNG key.
    w = jax.random.normal(k2, (256, 64), dtype=jnp.float32) * 0.25
    # Cast or evaluate `ref_fp32` in explicit floating-point precision.
    ref_fp32 = jnp.dot(x, w, preferred_element_type=jnp.float32)
    # Cast or evaluate `out_bf16_fp32acc` in explicit floating-point precision.
    out_bf16_fp32acc = jnp.dot(
        x.astype(jnp.bfloat16), w.astype(jnp.bfloat16), preferred_element_type=jnp.float32
    )
    # Cast or evaluate `out_bf16_bf16acc` in explicit floating-point precision.
    out_bf16_bf16acc = jnp.dot(
        x.astype(jnp.bfloat16), w.astype(jnp.bfloat16), preferred_element_type=jnp.bfloat16
    ).astype(jnp.float32)
    # Reduce across the target axis to summarize `scale`.
    column_max = jnp.max(jnp.abs(w), axis=0, keepdims=True)
    scale = jnp.where(column_max == 0, 1.0, column_max / 127.0)
    # The scale of 1 for a zero column avoids division by zero; its quantized values remain zero.
    w_int8 = jnp.clip(jnp.round(w / scale), -127, 127).astype(jnp.int8)
    # Cast or evaluate `out_int8_fp32acc` in explicit floating-point precision.
    out_int8_fp32acc = jnp.dot(x, w_int8.astype(jnp.float32) * scale, preferred_element_type=jnp.float32)
    # Initialize list `policies` for the stage values.
    policies = [
        ("bf16 (fp32 accum)", out_bf16_fp32acc),
        ("bf16 (bf16 accum)", out_bf16_bf16acc),
        ("int8 per-col (fp32 accum)", out_int8_fp32acc),
    ]
    # Compute `results` from `[]`
    results = []
    # Loop over `(label, tensor)` in `policies`:
    for label, tensor in policies:
        # Run `jnp.abs` to compute `diff`.
        diff = jnp.abs(tensor - ref_fp32)
        # Append the computed value via `results.append({`.
        results.append({
            "policy": label,
            "max_abs_err": round(float(jnp.max(diff)), 5),
            "mean_abs_err": round(float(jnp.mean(diff)), 5),
            "weight_bytes": int(w_int8.size),
            "scale_bytes": int(scale.size * 4),
        })
    # Return `results` to the caller.
    return results
Code building blocks in this step
x.sum(axis=...) / x.mean(axis=..., keepdims=...)— Reduces values along the namedaxis(the axis you name is collapsed unlesskeepdims=True).jax.random.PRNGKey(seed) & jax.random.split(key)— Manages explicit, stateless PRNG keys—always split a key before passing subkeys into independent random draws.
Measuring both max and mean absolute error across accumulation dtypes quantifies why FP32 accumulation is standard on TPU MXUs.
2 Capture a warmed XProf trace and verify *.xplane.pb output
Append capture_warmed_trace and the verification assertions to main.py.
# Step 2 — Capture a warmed XProf trace and verify *.xplane.pb output: Warming up before entering jax.profiler.trace ensures the captured...
def capture_warmed_trace(steps=4, trace_dir=None):
    # Construct `x` via `jnp.ones((256, 256), dtype=jnp.bfloat16)`
    x = jnp.ones((256, 256), dtype=jnp.bfloat16)
    # Wrap with `jax.jit` (`step_fn`) so XLA traces and compiles the function.
    step_fn = jax.jit(lambda a: jnp.dot(a, a, preferred_element_type=jnp.float32).astype(jnp.bfloat16))
    # Record execution timing or profiler trace in `t0`.
    t0 = time.perf_counter()
    # Synchronize host execution until asynchronous device computation completes.
    jax.block_until_ready(step_fn(x))
    # Record execution timing or profiler trace in `warmup_ms`.
    warmup_ms = (time.perf_counter() - t0) * 1000.0
    # Enter managed runtime/context scope for this block:
    trace_dir = Path(trace_dir or os.environ.get("TPU_TRACE_DIR", "./tpu-xprof-trace")).expanduser().resolve()
    trace_dir.mkdir(parents=True, exist_ok=True)
    with jax.profiler.trace(str(trace_dir)):
        # Record execution timing or profiler trace in `t1`.
        t1 = time.perf_counter()
        # Repeat the update loop over `range(steps)` steps:
        for _ in range(steps):
            # Run `step_fn` to compute `x`.
            x = step_fn(x)
        # Synchronize host execution until asynchronous device computation completes.
        jax.block_until_ready(x)
        # Record execution timing or profiler trace in `steady_ms`.
        steady_ms = (time.perf_counter() - t1) * 1000.0 / steps
    # Collect files from the retained trace directory.
    xplane_files = list(trace_dir.rglob("*.xplane.pb"))
    # Return `{'warmup_ms': warmup_ms, 'steady_ms': steady_ms, 'xplane_count': len(xplane_files)}` to the caller.
    return {"warmup_ms": warmup_ms, "steady_ms": steady_ms, "xplane_count": len(xplane_files), "trace_dir": str(trace_dir)}


# Run `evaluate_precision_policies` to compute `prec_table`.
prec_table = evaluate_precision_policies()
# Run `capture_warmed_trace` to compute `trace_info`.
trace_info = capture_warmed_trace()
# Assert invariant `trace_info["xplane_count"] >= 1` holds
assert trace_info["xplane_count"] >= 1
# Assert invariant `prec_table[0]["max_abs_err"] < prec_table[1]["max_abs_err"]` holds
assert prec_table[0]["max_abs_err"] < prec_table[1]["max_abs_err"]
# Print the observed values to compare against the expected result.
print("Precision comparison:", prec_table)
# Print diagnostic summary of the computed outputs.
print("Captured *.xplane.pb trace count:", trace_info["xplane_count"], "steady_ms:", round(trace_info["steady_ms"], 4))
Code building blocks in this step
jnp.zeros / jnp.ones(shape, dtype=...)— Allocates a tensor of the givenshapeinitialized with constants.jax.jit(fn) / @jax.jit— Tracesfnwith abstract shapes and compiles a fused XLA executable cached by input shape and dtype.jax.block_until_ready(output)— Synchronizes with the accelerator/CPU device so asynchronous dispatch finishes before wall-clock timing.
Warming up before entering jax.profiler.trace ensures the captured *.xplane.pb file records steady-state execution rather than first-call compilation.
3 Step 3: Verify invariants on the completed state
Run the final shape and numerical assertions to confirm the state built in Steps 1 and 2.
assert trace_info["xplane_count"] >= 1
assert prec_table[0]["max_abs_err"] < prec_table[1]["max_abs_err"]
Code building blocks in this step
assert condition— Verify that the observed output shape, status, or numerical value satisfies the contract.
Checking these invariants confirms the computation is ready for the full worked experiment.
View the cumulative build in main.py
These blocks append in order to the same file.
# Step 1 — Compare BF16 (FP32 vs BF16 accumulation) and per-channel INT8 matmul errors: Measuring both max and mean absolute error across accumulation...
# Import pathlib (Path) for this computation.
from pathlib import Path
import os
import tempfile
import time
import jax
import jax.numpy as jnp
import numpy as np


# Function `evaluate_precision_policies(seed)` implementing this stage's computation:
def evaluate_precision_policies(seed=0):
    # Create or split explicit PRNG key(s) (`(k1, k2)`) for reproducible randomness.
    k1, k2 = jax.random.split(jax.random.PRNGKey(seed))
    # Sample deterministic random values into `x` using an explicit PRNG key.
    x = jax.random.normal(k1, (64, 256), dtype=jnp.float32)
    # Sample deterministic random values into `w` using an explicit PRNG key.
    w = jax.random.normal(k2, (256, 64), dtype=jnp.float32) * 0.25
    # Cast or evaluate `ref_fp32` in explicit floating-point precision.
    ref_fp32 = jnp.dot(x, w, preferred_element_type=jnp.float32)
    # Cast or evaluate `out_bf16_fp32acc` in explicit floating-point precision.
    out_bf16_fp32acc = jnp.dot(
        x.astype(jnp.bfloat16), w.astype(jnp.bfloat16), preferred_element_type=jnp.float32
    )
    # Cast or evaluate `out_bf16_bf16acc` in explicit floating-point precision.
    out_bf16_bf16acc = jnp.dot(
        x.astype(jnp.bfloat16), w.astype(jnp.bfloat16), preferred_element_type=jnp.bfloat16
    ).astype(jnp.float32)
    # Reduce across the target axis to summarize `scale`.
    column_max = jnp.max(jnp.abs(w), axis=0, keepdims=True)
    scale = jnp.where(column_max == 0, 1.0, column_max / 127.0)
    # The scale of 1 for a zero column avoids division by zero; its quantized values remain zero.
    w_int8 = jnp.clip(jnp.round(w / scale), -127, 127).astype(jnp.int8)
    # Cast or evaluate `out_int8_fp32acc` in explicit floating-point precision.
    out_int8_fp32acc = jnp.dot(x, w_int8.astype(jnp.float32) * scale, preferred_element_type=jnp.float32)
    # Initialize list `policies` for the stage values.
    policies = [
        ("bf16 (fp32 accum)", out_bf16_fp32acc),
        ("bf16 (bf16 accum)", out_bf16_bf16acc),
        ("int8 per-col (fp32 accum)", out_int8_fp32acc),
    ]
    # Compute `results` from `[]`
    results = []
    # Loop over `(label, tensor)` in `policies`:
    for label, tensor in policies:
        # Run `jnp.abs` to compute `diff`.
        diff = jnp.abs(tensor - ref_fp32)
        # Append the computed value via `results.append({`.
        results.append({
            "policy": label,
            "max_abs_err": round(float(jnp.max(diff)), 5),
            "mean_abs_err": round(float(jnp.mean(diff)), 5),
            "weight_bytes": int(w_int8.size),
            "scale_bytes": int(scale.size * 4),
        })
    # Return `results` to the caller.
    return results


# Step 2 — Capture a warmed XProf trace and verify *.xplane.pb output: Warming up before entering jax.profiler.trace ensures the captured...
def capture_warmed_trace(steps=4, trace_dir=None):
    # Construct `x` via `jnp.ones((256, 256), dtype=jnp.bfloat16)`
    x = jnp.ones((256, 256), dtype=jnp.bfloat16)
    # Wrap with `jax.jit` (`step_fn`) so XLA traces and compiles the function.
    step_fn = jax.jit(lambda a: jnp.dot(a, a, preferred_element_type=jnp.float32).astype(jnp.bfloat16))
    # Record execution timing or profiler trace in `t0`.
    t0 = time.perf_counter()
    # Synchronize host execution until asynchronous device computation completes.
    jax.block_until_ready(step_fn(x))
    # Record execution timing or profiler trace in `warmup_ms`.
    warmup_ms = (time.perf_counter() - t0) * 1000.0
    # Enter managed runtime/context scope for this block:
    trace_dir = Path(trace_dir or os.environ.get("TPU_TRACE_DIR", "./tpu-xprof-trace")).expanduser().resolve()
    trace_dir.mkdir(parents=True, exist_ok=True)
    with jax.profiler.trace(str(trace_dir)):
        # Record execution timing or profiler trace in `t1`.
        t1 = time.perf_counter()
        # Repeat the update loop over `range(steps)` steps:
        for _ in range(steps):
            # Run `step_fn` to compute `x`.
            x = step_fn(x)
        # Synchronize host execution until asynchronous device computation completes.
        jax.block_until_ready(x)
        # Record execution timing or profiler trace in `steady_ms`.
        steady_ms = (time.perf_counter() - t1) * 1000.0 / steps
    # Collect files from the retained trace directory.
    xplane_files = list(trace_dir.rglob("*.xplane.pb"))
    # Return `{'warmup_ms': warmup_ms, 'steady_ms': steady_ms, 'xplane_count': len(xplane_files)}` to the caller.
    return {"warmup_ms": warmup_ms, "steady_ms": steady_ms, "xplane_count": len(xplane_files), "trace_dir": str(trace_dir)}


# Run `evaluate_precision_policies` to compute `prec_table`.
prec_table = evaluate_precision_policies()
# Run `capture_warmed_trace` to compute `trace_info`.
trace_info = capture_warmed_trace()
# Assert invariant `trace_info["xplane_count"] >= 1` holds
assert trace_info["xplane_count"] >= 1
# Assert invariant `prec_table[0]["max_abs_err"] < prec_table[1]["max_abs_err"]` holds
assert prec_table[0]["max_abs_err"] < prec_table[1]["max_abs_err"]
# Print the observed values to compare against the expected result.
print("Precision comparison:", prec_table)
# Print diagnostic summary of the computed outputs.
print("Captured *.xplane.pb trace count:", trace_info["xplane_count"], "steady_ms:", round(trace_info["steady_ms"], 4))

assert trace_info["xplane_count"] >= 1
assert prec_table[0]["max_abs_err"] < prec_table[1]["max_abs_err"]
Run the example
python3 phases/21-tpu-systems/02-bfloat16-int8-precision-and-xprof-profiling/code/main.pyAbout this command
This shortcut uses an activated macOS/Linux course environment in the repository folder. For Windows, use the explicit interpreter command in “Setup help” above. The script includes worked examples and reference solutions.
Inspect the complete assembled example
# Step 1 — Compare BF16 (FP32 vs BF16 accumulation) and per-channel INT8 matmul errors: Measuring both max and mean absolute error across accumulation...
# Import pathlib (Path) for this computation.
from pathlib import Path
import os
import time
import jax
import jax.numpy as jnp
import numpy as np


# Function `evaluate_precision_policies(seed)` implementing this stage's computation:
def evaluate_precision_policies(seed=0):
    # Create or split explicit PRNG key(s) (`(k1, k2)`) for reproducible randomness.
    k1, k2 = jax.random.split(jax.random.PRNGKey(seed))
    # Sample deterministic random values into `x` using an explicit PRNG key.
    x = jax.random.normal(k1, (64, 256), dtype=jnp.float32)
    # Sample deterministic random values into `w` using an explicit PRNG key.
    w = jax.random.normal(k2, (256, 64), dtype=jnp.float32) * 0.25
    # Cast or evaluate `ref_fp32` in explicit floating-point precision.
    ref_fp32 = jnp.dot(x, w, preferred_element_type=jnp.float32)
    # Cast or evaluate `out_bf16_fp32acc` in explicit floating-point precision.
    out_bf16_fp32acc = jnp.dot(
        x.astype(jnp.bfloat16), w.astype(jnp.bfloat16), preferred_element_type=jnp.float32
    )
    # Cast or evaluate `out_bf16_bf16acc` in explicit floating-point precision.
    out_bf16_bf16acc = jnp.dot(
        x.astype(jnp.bfloat16), w.astype(jnp.bfloat16), preferred_element_type=jnp.bfloat16
    ).astype(jnp.float32)
    # Reduce across the target axis to summarize `scale`.
    column_max = jnp.max(jnp.abs(w), axis=0, keepdims=True)
    scale = jnp.where(column_max == 0, 1.0, column_max / 127.0)
    # The scale of 1 for a zero column avoids division by zero; its quantized values remain zero.
    w_int8 = jnp.clip(jnp.round(w / scale), -127, 127).astype(jnp.int8)
    # Cast or evaluate `out_int8_fp32acc` in explicit floating-point precision.
    out_int8_fp32acc = jnp.dot(x, w_int8.astype(jnp.float32) * scale, preferred_element_type=jnp.float32)
    # Initialize list `policies` for the stage values.
    policies = [
        ("bf16 (fp32 accum)", out_bf16_fp32acc),
        ("bf16 (bf16 accum)", out_bf16_bf16acc),
        ("int8 per-col (fp32 accum)", out_int8_fp32acc),
    ]
    # Compute `results` from `[]`
    results = []
    # Loop over `(label, tensor)` in `policies`:
    for label, tensor in policies:
        # Run `jnp.abs` to compute `diff`.
        diff = jnp.abs(tensor - ref_fp32)
        # Append the computed value via `results.append({`.
        results.append({
            "policy": label,
            "max_abs_err": round(float(jnp.max(diff)), 5),
            "mean_abs_err": round(float(jnp.mean(diff)), 5),
            "weight_bytes": int(w_int8.size),
            "scale_bytes": int(scale.size * 4),
        })
    # Return `results` to the caller.
    return results


# Step 2 — Capture a warmed XProf trace and verify *.xplane.pb output: Warming up before entering jax.profiler.trace ensures the captured...
def capture_warmed_trace(steps=4, trace_dir=None):
    # Construct `x` via `jnp.ones((256, 256), dtype=jnp.bfloat16)`
    x = jnp.ones((256, 256), dtype=jnp.bfloat16)
    # Wrap with `jax.jit` (`step_fn`) so XLA traces and compiles the function.
    step_fn = jax.jit(lambda a: jnp.dot(a, a, preferred_element_type=jnp.float32).astype(jnp.bfloat16))
    # Record execution timing or profiler trace in `t0`.
    t0 = time.perf_counter()
    # Synchronize host execution until asynchronous device computation completes.
    jax.block_until_ready(step_fn(x))
    # Record execution timing or profiler trace in `warmup_ms`.
    warmup_ms = (time.perf_counter() - t0) * 1000.0
    # Enter managed runtime/context scope for this block:
    trace_dir = Path(trace_dir or os.environ.get("TPU_TRACE_DIR", "./tpu-xprof-trace")).expanduser().resolve()
    trace_dir.mkdir(parents=True, exist_ok=True)
    with jax.profiler.trace(str(trace_dir)):
        # Record execution timing or profiler trace in `t1`.
        t1 = time.perf_counter()
        # Repeat the update loop over `range(steps)` steps:
        for _ in range(steps):
            # Run `step_fn` to compute `x`.
            x = step_fn(x)
        # Synchronize host execution until asynchronous device computation completes.
        jax.block_until_ready(x)
        # Record execution timing or profiler trace in `steady_ms`.
        steady_ms = (time.perf_counter() - t1) * 1000.0 / steps
    # Collect files from the retained trace directory.
    xplane_files = list(trace_dir.rglob("*.xplane.pb"))
    # Return `{'warmup_ms': warmup_ms, 'steady_ms': steady_ms, 'xplane_count': len(xplane_files)}` to the caller.
    return {"warmup_ms": warmup_ms, "steady_ms": steady_ms, "xplane_count": len(xplane_files), "trace_dir": str(trace_dir)}


# Run `evaluate_precision_policies` to compute `prec_table`.
prec_table = evaluate_precision_policies()
# Run `capture_warmed_trace` to compute `trace_info`.
trace_info = capture_warmed_trace()
# Assert invariant `trace_info["xplane_count"] >= 1` holds
assert trace_info["xplane_count"] >= 1
# Assert invariant `prec_table[0]["max_abs_err"] < prec_table[1]["max_abs_err"]` holds
assert prec_table[0]["max_abs_err"] < prec_table[1]["max_abs_err"]
# Print the observed values to compare against the expected result.
print("Precision comparison:", prec_table)
# Print diagnostic summary of the computed outputs.
print("Retained trace directory:", trace_info["trace_dir"])
print("Captured *.xplane.pb trace count:", trace_info["xplane_count"], "steady_ms:", round(trace_info["steady_ms"], 4))
Expected result: Prints the precision error table (showing lower error for fp32 accumulation than bf16 accumulation) and confirms that at least one *.xplane.pb trace file was captured.
Recorded reference execution
Reference output captured from executing the complete lesson script (code/main.py) and its assertions in the course CPU environment.
Precision comparison: [{'policy': 'bf16 (fp32 accum)', 'max_abs_err': 0.03718, 'mean_abs_err': 0.00756, 'weight_bytes': 16384, 'scale_bytes': 256}, {'policy': 'bf16 (bf16 accum)', 'max_abs_err': 0.05545, 'mean_abs_err': 0.00912, 'weight_bytes': 16384, 'scale_bytes': 256}, {'policy': 'int8 per-col (fp32 accum)', 'max_abs_err': 0.12516, 'mean_abs_err': 0.02322, 'weight_bytes': 16384, 'scale_bytes': 256}]
Captured *.xplane.pb trace count: 4 steady_ms: 0.0845
Precision comparison: [{'policy': 'bf16 (fp32 accum)', 'max_abs_err': 0.03718, 'mean_abs_err': 0.00756, 'weight_bytes': 16384, 'scale_bytes': 256}, {'policy': 'bf16 (bf16 accum)', 'max_abs_err': 0.05545, 'mean_abs_err': 0.00912, 'weight_bytes': 16384, 'scale_bytes': 256}, {'policy': 'int8 per-col (fp32 accum)', 'max_abs_err': 0.12516, 'mean_abs_err': 0.02322, 'weight_bytes': 16384, 'scale_bytes': 256}]
Retained trace directory: /Users/tahabsn/Documents/ChatGPT/jaxpathways/tpu-xprof-trace
Captured *.xplane.pb trace count: 4 steady_ms: 0.0663
BF16-accum / FP32-accum max error ratio: 1.49
Warmup ms: 16.804 Traced steady step ms: 0.0663
Seed 42 mean errors: {'bf16 (fp32 accum)': 0.0075, 'bf16 (bf16 accum)': 0.00902, 'int8 per-col (fp32 accum)': 0.02182} xplane files: 4
Mean error (per-channel vs per-tensor): 0.01389 0.0979
xplane.pb bytes: 259893
PASS: tpu-06
Download execution record · The notebook includes executed cells and figure outputs. Compare your run with these values; timings depend on the machine.
Compare FP32 accumulation vs BF16 accumulation error ratio
# Experiment — Compare FP32 accumulation vs BF16 accumulation error ratio: Passing preferred_element_type=jnp.float32 to jnp.dot or...
fp32_acc_err = prec_table[0]["max_abs_err"]
# Compute `bf16_acc_err` from `prec_table[1]["max_abs_err"]`
bf16_acc_err = prec_table[1]["max_abs_err"]
# Run `round` to compute `ratio`.
ratio = round(bf16_acc_err / fp32_acc_err, 2)
# Print the observed values to compare against the expected result.
print("BF16-accum / FP32-accum max error ratio:", ratio)
# Assert invariant `ratio > 1.3` holds
assert ratio > 1.3
Expected: Accumulating in BF16 increases maximum absolute error by roughly compared to FP32 accumulation.
Passing preferred_element_type=jnp.float32 to jnp.dot or lax.dot_general preserves FP32 accumulation on TPU.
Compare warmup duration vs traced steady-state step duration
# Experiment — Compare warmup duration vs traced steady-state step duration: Keeping warmup outside jax.profiler.trace prevents XLA...
# Print the observed values to compare against the expected result.
print("Warmup ms:", round(trace_info["warmup_ms"], 3), "Traced steady step ms:", round(trace_info["steady_ms"], 4))
# Assert invariant `trace_info["warmup_ms"] > trace_info["steady_ms"]` holds
assert trace_info["warmup_ms"] > trace_info["steady_ms"]
Expected: Warmup takes significantly longer than a single steady-state step inside the profiler block.
Keeping warmup outside jax.profiler.trace prevents XLA compilation from dominating the captured XProf timeline.
Make it yours
Where to put your code: Append your solution at the bottom of phases/21-tpu-systems/02-bfloat16-int8-precision-and-xprof-profiling/code/main.py (or inside the Make it yours cell of exercises/tpu-06.ipynb) and run python3 phases/21-tpu-systems/02-bfloat16-int8-precision-and-xprof-profiling/code/main.py to verify your prediction before opening the reference solution.
Run evaluate_precision_policies(seed=42) and capture_warmed_trace(steps=3), then verify that bf16 (fp32 accum) has strictly lower mean_abs_err than bf16 (bf16 accum) and that xplane_count >= 1.
Show a writing guide and starter scaffold
How to write this exercise code: step-by-step recipe & starter scaffold
1. Key functions & syntax to use:
evaluate_precision_policies(...)— Callevaluate_precision_policieswith your updated parameters or inputs from this lesson's workspace.capture_warmed_trace(...)— Callcapture_warmed_tracewith your updated parameters or inputs from this lesson's workspace.assert condition— Verify that the observed output shape, status, or numerical value satisfies the contract.
2. Step-by-step implementation plan:
- Run
capture_warmed_traceto computet3. - Print the observed values to compare against the expected result.
- Assert that
p42[0]["mean_abs_err"] < p42[1]["mean_abs_err"] and t3["xplane_count"] >= 1.
# Exercise solution: Run evaluate_precision_policies(seed=42) and...
p42 = evaluate_precision_policies(...)  # TODO: compute p42
# Run `capture_warmed_trace` to compute `t3`.
t3 = capture_warmed_trace(...)  # TODO: compute t3
# Print the observed values to compare against the expected result.
print("Seed 42 mean errors:", {r["policy"]: r["mean_abs_err"] for r in p42}, "xplane files:", t3["xplane_count"])
# Assert that `p42[0]["mean_abs_err"] < p42[1]["mean_abs_err"] and t3["xplane_count"] >= 1`.
assert p42[0]["mean_abs_err"]  # TODO: complete assertion check
Reveal the reference solution
# Exercise solution: Run evaluate_precision_policies(seed=42) and...
p42 = evaluate_precision_policies(seed=42)
# Run `capture_warmed_trace` to compute `t3`.
t3 = capture_warmed_trace(steps=3)
# Print the observed values to compare against the expected result.
print("Seed 42 mean errors:", {r["policy"]: r["mean_abs_err"] for r in p42}, "xplane files:", t3["xplane_count"])
# Assert that `p42[0]["mean_abs_err"] < p42[1]["mean_abs_err"] and t3["xplane_count"] >= 1`.
assert p42[0]["mean_abs_err"] < p42[1]["mean_abs_err"] and t3["xplane_count"] >= 1
Compare per-channel vs per-tensor INT8 quantization error
Foundations
Quantize w with a single global scalar scale_global = jnp.max(jnp.abs(w)) / 127.0 and compare its max error against per-channel quantization when one column of w is scaled by 10.0.
Show a writing guide and starter scaffold
How to write this practice solution: step-by-step recipe & starter scaffold
1. Key functions & syntax to use:
x.sum(axis=...) / x.mean(axis=..., keepdims=...)— Reduces values along the namedaxis(the axis you name is collapsed unlesskeepdims=True).jax.random.PRNGKey(seed) & jax.random.split(key)— Manages explicit, stateless PRNG keys—always split a key before passing subkeys into independent random draws.
2. Step-by-step implementation plan:
- Compare per-channel vs per-tensor INT8 quantization error (Foundations): One outlier channel stretches a per-tensor scale factor and...
- Create or split explicit PRNG key(s) (
w_skew) for reproducible randomness. - Compute
w_skewfromw_skew.at[:, 0].multiply(10.0) - Create or split explicit PRNG key(s) (
x_in) for reproducible randomness. - Cast or evaluate
refin explicit floating-point precision.
# Compare per-channel vs per-tensor INT8 quantization error (Foundations): One outlier channel stretches a per-tensor scale factor and...
# Create or split explicit PRNG key(s) (`w_skew`) for reproducible randomness.
w_skew = jax.random.normal(...)  # TODO: compute w_skew
# Compute `w_skew` from `w_skew.at[:, 0].multiply(10.0)`
w_skew = ...  # TODO: compute w_skew
# Create or split explicit PRNG key(s) (`x_in`) for reproducible randomness.
x_in = jax.random.normal(...)  # TODO: compute x_in
# Cast or evaluate `ref` in explicit floating-point precision.
ref = jnp.dot(...)  # TODO: compute ref
# Reduce along axis=0 to compute `s_col`.
s_col = jnp.max(...)  # TODO: compute s_col
# Aggregate array values to compute `s_glb`.
s_glb = jnp.max(...)  # TODO: compute s_glb
# Combine or mask array elements to form `q_col`.
q_col = jnp.clip(...)  # TODO: compute q_col
# Combine or mask array elements to form `q_glb`.
q_glb = jnp.clip(...)  # TODO: compute q_glb
# Aggregate array values to compute `err_col`.
err_col = float(...)  # TODO: compute err_col
# Aggregate array values to compute `err_glb`.
err_glb = float(...)  # TODO: compute err_glb
# Print diagnostic summary of the computed outputs.
print("Mean error (per-channel vs per-tensor):", round(err_col, 5), round(err_glb, 5))
# Assert invariant `err_col < err_glb` holds
assert err_col  # TODO: complete assertion check
Show a hint
Multiply w[:, :1] by 10.0 and compare per-column axis=0 scale vs global scalar scale.
Reveal reference solution and reasoning
# Compare per-channel vs per-tensor INT8 quantization error (Foundations): One outlier channel stretches a per-tensor scale factor and...
# Create or split explicit PRNG key(s) (`w_skew`) for reproducible randomness.
w_skew = jax.random.normal(jax.random.PRNGKey(9), (128, 32), dtype=jnp.float32) * 0.2
# Compute `w_skew` from `w_skew.at[:, 0].multiply(10.0)`
w_skew = w_skew.at[:, 0].multiply(10.0)
# Create or split explicit PRNG key(s) (`x_in`) for reproducible randomness.
x_in = jax.random.normal(jax.random.PRNGKey(10), (32, 128), dtype=jnp.float32)
# Cast or evaluate `ref` in explicit floating-point precision.
ref = jnp.dot(x_in, w_skew, preferred_element_type=jnp.float32)
# Reduce along axis=0 to compute `s_col`.
s_col = jnp.max(jnp.abs(w_skew), axis=0, keepdims=True) / 127.0
# Aggregate array values to compute `s_glb`.
s_glb = jnp.max(jnp.abs(w_skew)) / 127.0
# Combine or mask array elements to form `q_col`.
q_col = jnp.clip(jnp.round(w_skew / s_col), -127, 127).astype(jnp.int8)
# Combine or mask array elements to form `q_glb`.
q_glb = jnp.clip(jnp.round(w_skew / s_glb), -127, 127).astype(jnp.int8)
# Aggregate array values to compute `err_col`.
err_col = float(jnp.mean(jnp.abs(jnp.dot(x_in, q_col.astype(jnp.float32) * s_col) - ref)))
# Aggregate array values to compute `err_glb`.
err_glb = float(jnp.mean(jnp.abs(jnp.dot(x_in, q_glb.astype(jnp.float32) * s_glb) - ref)))
# Print diagnostic summary of the computed outputs.
print("Mean error (per-channel vs per-tensor):", round(err_col, 5), round(err_glb, 5))
# Assert invariant `err_col < err_glb` holds
assert err_col < err_glb
One outlier channel stretches a per-tensor scale factor and crushes small channels into a few integer buckets; per-channel scaling isolates each column.
Verify non-empty XProf *.xplane.pb byte size
Transfer / diagnosis
Capture a trace in a temporary directory and verify that the generated *.xplane.pb file has stat().st_size > 0.
Show a writing guide and starter scaffold
How to write this practice solution: step-by-step recipe & starter scaffold
1. Key functions & syntax to use:
jnp.zeros / jnp.ones(shape, dtype=...)— Allocates a tensor of the givenshapeinitialized with constants.jax.jit(fn) / @jax.jit— Tracesfnwith abstract shapes and compiles a fused XLA executable cached by input shape and dtype.jax.block_until_ready(output)— Synchronizes with the accelerator/CPU device so asynchronous dispatch finishes before wall-clock timing.
2. Step-by-step implementation plan:
- Create an isolated temporary directory to run and inspect artifacts safely:
- Construct
aviajnp.ones((128, 128), dtype=jnp.bfloat16) - Wrap with
jax.jit(fn) so XLA traces and compiles the function. - Synchronize host execution until asynchronous device computation completes.
- Enter managed runtime/context scope for this block:
# Verify non-empty XProf *.xplane.pb byte size (Transfer / diagnosis): Verifying a non-empty *.xplane.pb file confirms the profiler...
# Create an isolated temporary directory to run and inspect artifacts safely:
with tempfile.TemporaryDirectory(prefix="tpu-xplane-size-") as d:
    # Construct `a` via `jnp.ones((128, 128), dtype=jnp.bfloat16)`
    a = jnp.ones(...)  # TODO: compute a
    # Wrap with `jax.jit` (`fn`) so XLA traces and compiles the function.
    fn = jax.jit(...)  # TODO: compute fn
    # Synchronize host execution until asynchronous device computation completes.
    jax.block_until_ready(fn(a))
    # Enter managed runtime/context scope for this block:
    with jax.profiler.trace(d):
        # Synchronize host execution until asynchronous device computation completes.
        jax.block_until_ready(fn(a))
    # Read or serialize artifact data on disk (`pb`).
    pb = list(...)  # TODO: compute pb
    # Run `pb.stat` to compute `size_bytes`.
    size_bytes = pb.stat(...)  # TODO: compute size_bytes
# Print the observed values to compare against the expected result.
print("xplane.pb bytes:", size_bytes)
# Assert invariant `size_bytes > 0` holds
assert size_bytes  # TODO: complete assertion check
Show a hint
Check xplane_files[0].stat().st_size > 0.
Reveal reference solution and reasoning
# Verify non-empty XProf *.xplane.pb byte size (Transfer / diagnosis): Verifying a non-empty *.xplane.pb file confirms the profiler...
# Create an isolated temporary directory to run and inspect artifacts safely:
with tempfile.TemporaryDirectory(prefix="tpu-xplane-size-") as d:
    # Construct `a` via `jnp.ones((128, 128), dtype=jnp.bfloat16)`
    a = jnp.ones((128, 128), dtype=jnp.bfloat16)
    # Wrap with `jax.jit` (`fn`) so XLA traces and compiles the function.
    fn = jax.jit(lambda z: z @ z)
    # Synchronize host execution until asynchronous device computation completes.
    jax.block_until_ready(fn(a))
    # Enter managed runtime/context scope for this block:
    with jax.profiler.trace(d):
        # Synchronize host execution until asynchronous device computation completes.
        jax.block_until_ready(fn(a))
    # Read or serialize artifact data on disk (`pb`).
    pb = list(Path(d).rglob("*.xplane.pb"))[0]
    # Run `pb.stat` to compute `size_bytes`.
    size_bytes = pb.stat().st_size
# Print the observed values to compare against the expected result.
print("xplane.pb bytes:", size_bytes)
# Assert invariant `size_bytes > 0` holds
assert size_bytes > 0
Verifying a non-empty *.xplane.pb file confirms the profiler flushed device and host events before closing.
Diagnose the result
If XProf shows large gaps between device steps on your TPU VM, check for un-jitted Python work, host-side NumPy conversions, or synchronous print(array) calls inside the training step.
Carry forward
- Use
bfloat16matmul operands withpreferred_element_type=jnp.float32accumulation, and use per-channel scales when quantizing weights toint8. - Capture warmed
jax.profiler.trace(*.xplane.pb) artifacts on the TPU VM and copy them back withgcloud compute tpus tpu-vm scp --recursebefore deleting the VM.
Keep your evidence
Keep the BF16 vs INT8 error summary, FP32-vs-BF16 accumulator drift comparison, and captured *.xplane.pb trace receipt.
Save your modified code, its output, and an explanation of your prediction. Checkpoint answers and exercise evidence are tracked separately.
Saved in this browser. Export or back up your portfolio anytime in My learning.
Verified on local CPU. Stage to a Cloud TPU VM via Cloud TPU setup to record accelerator execution receipts (TODO: add automated Cloud TPU CI execution receipts).
Primary references
Phase 21 Integration Project
Bring this phase together: Estimate optimizer-state bytes and calculate supplied-rate scaling efficiency
Checkpoint to prove: Compare TPU v5e, v5p, and v6e ridge points, budget training and KV-cache HBM, measure BF16/INT8 matmul error with FP32 accumulation, and capture a warmed XProf trace.
Work in projects/tpu-systems-audit/starter/model.py. Complete stages 1 and 2 for independent calculations and changed-condition diagnosis, then retain the stage 3 evidence with --evidence-dir runs/tpu-systems-audit. Stage 4 integrates the checks. Learner commands explicitly select the starter; --implementation solution is instructor reference execution. This bounded practice does not certify the entire phase or target hardware.