 JAX Pathways
Phase 08 / Performance diagnosis
Diagnose recompilation and host synchronization
Revision v0.18.1 · Updated since your last visit. Review the changes; your progress is saved.
Lesson · about 80 minutes · CPU practice
Find a shape-changing call or host read and connect it to observed overhead.
Phase study guide: preparation, milestones and project evidence
Before you start
Before this: Benchmark asynchronous work correctly
Hardware: CPU
Setup help: Python, notebook, or Cloud TPU VM
Use the tested CPU packages (the recorded environment uses Python 3.14.3). Other Python versions require separate checks. Hardware receipts apply only to their recorded source, environment, hardware, and cases; they do not qualify every lesson or TPU configuration. See the TPU performance and hardware evidence guide. The optional Cloud TPU specialization explains target-specific execution boundaries. Logical CPU devices practice partitioning; they do not simulate TPU performance.
Download the repository ZIP or use your existing checkout. Extract it and open a terminal in the folder containing requirements-cpu.txt. The beginner ZIP is separate; these lessons use the full repository folder.
python3 -m venv .venv
source .venv/bin/activate
python -m pip install -r requirements-cpu.txtpy -3 -m venv .venv
.\.venv\Scripts\python.exe -m pip install -r requirements-cpu.txtAfter activation, run the complete worked example from that same folder:
python phases/08-performance/02-diagnose-recompilation-and-host-synchronization/code/main.py.\.venv\Scripts\python.exe phases/08-performance/02-diagnose-recompilation-and-host-synchronization/code/main.pyFor an incremental build, create main.py in your own practice folder, append each build block in order, and run python main.py with this environment active. Keep that file separate from the downloaded reference solution.
Download this lesson’s notebook. Open it with a Python kernel using the course environment. Run cells from the top after restarting the kernel; experiments depend on earlier definitions.
For local Jupyter, first install the course requirements using the Local Python steps, then use your environment’s Python to start Jupyter:
python -m pip install jupyterlab
python -m jupyter lab.\.venv\Scripts\python.exe -m pip install jupyterlab
.\.venv\Scripts\python.exe -m jupyter labSelect the downloaded performance-02.ipynb file in JupyterLab. The notebook contains reference solutions; make your prediction and attempt each practice task before opening them. Restart the kernel before changing logical device setup.
The worked reference for this lesson is CPU-validated. Some references explicitly configure logical CPU devices; setting JAX_PLATFORMS does not adapt them to a TPU. Follow the execution matrix and reviewed multi-host example before attempting a target run.
For accelerator preparation, study TPU setup, observed runtime receipts, checkpointed jobs and precision and retained traces. Current receipts cover bounded v5e1 launch, resume, and precision checks; four single-device Pallas cases; and a four-device v5e collective fixture. Each receipt is limited to its recorded source, environment, cases, and hardware. It does not qualify all lessons or TPU configurations. Cloud provisioning is optional for CPU learning.
Check: A JSON ledger of four calls and observed Python trace events. Checked scores include , and ; event deltas are recorded rather than fixed by the lesson.
Revisit the guided CPU setup · Open 19: TPU Setup. Package instructions are CPU instructions; Windows and accelerator environments need their own validation.
What you will be able to do
- Record shapes, dtypes and dynamic/static choices beside observed tracing.
- Separate Python trace diagnostics from compilation evidence.
- Keep ordinary numerical hyperparameters dynamic when their values need not determine program structure.
- Compare per-step host consumption with one final host consumption while checking equivalent results.
The problem
A new batch size makes one call pause; reading a metric makes another loop wait. Those delays can look similar, but they have different causes. We’ll record the shapes, dtypes and static choices of each call, then inspect where Python asks for device values. The evidence will guide the change.
The idea
Slow steps can come from preparing new program specializations or from waiting for already-compiled work. Use a controlled call ledger and timing boundaries to separate those causes.
Distinguish new tracing from host waiting
Two different costs can look like a pause: staging a new signature and waiting for already-dispatched work. First vary one signature component while keeping the function and process fixed; then inspect host-side reads such as converting a device scalar to Python. A float(score) wait does not itself imply a new trace.
The trace counter answers only whether this diagnostic observed Python tracing. Combine it with synchronized timing or a trace before deciding which change affected the workload.
A call signature is different from its numerical data
The function sums squared inputs after multiplying by a gain. For , gain 1 gives 140 and gain 2 gives 560, yet changing the float32 scalar value leaves shape and dtype unchanged. The same specialization can therefore consume different numerical values.
Changing the input length from 8 to 12 changes its abstract shape and is a plausible reason for a new trace. Alter one factor at a time; sharding, callable identity and compiler context can also affect specialization.
call → (shape, dtype, static choices) → specialization
             dynamic values → execution of that program
Observe tracing without mislabeling compilation
The Python list append runs when JAX traces the function; later compiled numerical execution does not replay that Python statement. The list is an intentionally simple tracing diagnostic, not optimizer state or an accelerator callback.
In the recorded calls, observed trace deltas are : initial signature, changed values, changed dynamic gain, then length 12. This counter records Python tracing events, not exact compiler invocations. Use compile logs or a profiler when the claim concerns compiler behavior, and name the observed event.
Run instructions: Capture public compilation diagnostics on macOS/Linux
# Capture public compilation diagnostics on macOS/Linux
JAX_LOG_COMPILES=1 python diagnosis.py 2> compile.log
Expected:
The usual ledger appears in the terminal. compile.log contains JAX diagnostics, including tracing and compilation messages when observed. Read the named stage in each line; do not count every line as a compile.
Run instructions: Capture diagnostics in PowerShell
# Capture diagnostics in PowerShell
$env:JAX_LOG_COMPILES="1"
python diagnosis.py 2> compile.log
Remove-Item Env:JAX_LOG_COMPILES
Expected:
The ledger appears in the terminal and diagnostics are captured in compile.log. Removing the environment variable restores the shell setting after the run.
Choose static arguments for structure rather than convenience
A static Boolean lets Python choose a branch during tracing, so changing its value can create a separate specialization. This is appropriate for structural choices, not rapidly changing numeric data. A typed scalar array keeps a changing gain dynamic; a runtime Boolean condition can use lax.cond.
Predict how many distinct structures the code can select before making an argument static. Static values must be hashable, and changing a static option changes the program branch as well as specialization.
A host metric is an explicit synchronization boundary
Converting a scalar JAX value with float(score) asks Python for its contents, so it waits for the work needed to produce that value. Keeping it as a JAX scalar lets later device computations consume it; wait once at the final result when the metric is not needed immediately.
The exercise compares six dependent updates with a host read after each step against a final wait. Check that both produce the same scalar, then read their measured boundaries without assuming a speed ordering. If intermediate metrics matter, choose a bounded reporting interval rather than removing observability.
A new value is not necessarily a new trace
Predict before looking: Which call changes the input signature?
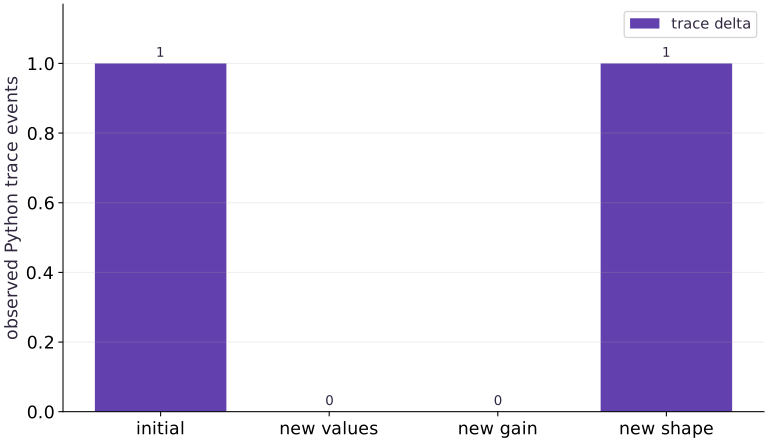
Read the figure
The horizontal axis lists four call categories; the vertical axis is the additional observed Python trace-event count per call, not time. The bars are 1 for the first signature, 0 for changed array values, 0 for changed dynamic gain, and 1 for a length-12 input. Zero-height bars mean the call ran without a new Python trace event in this retained run.
Connect it to the computation
Changing data and gain changed results while the signature stayed length 8; changing length to 12 produced the second observed trace. The bars support the narrow conclusion that this diagnostic saw events for the initial and changed-shape calls. They do not count device kernels or all compilation work. Next predict the trace delta when only a runtime scalar changes, then separately time any host read you suspect is waiting.
Figure data and execution details
Open full-size figureDownload data and provenance
The notebook contains the data experiment, plotting code, and recorded figure output. Rerun it to test your changes.
Your build: Create a separate main.py in your practice folder. Append each block in order and run python main.py in the lesson environment. The downloaded script is the complete reference, so keep it separate from your attempt.
1 Prepare a trace ledger
Create diagnosis.py in your activated course environment and add this block.
# Step 1 — Prepare a trace ledger
import json
import time
import numpy as np
import jax
import jax.numpy as jnp
cpu = jax.devices("cpu")[0]
trace_events = []
def score(x, gain):
    # Authoring diagnostic: this Python effect happens during tracing.
    # It is NOT model state and does not count executable compilations.
    trace_events.append({"shape": list(x.shape), "dtype": str(x.dtype)})
    return jnp.sum((x * gain)**2)
# Wrap with `jax.jit` (`compiled_score`) so XLA traces and compiles the function.
compiled_score = jax.jit(score)
x8 = jax.device_put(np.arange(8, dtype=np.float32), cpu)
x12 = jax.device_put(np.arange(12, dtype=np.float32), cpu)
# Wait for device work to finish before timing it or comparing its result on the host.
jax.block_until_ready((x8, x12))
This CPU experiment deliberately keeps the trace ledger outside numerical state. Run it in a fresh process when comparing observations.
Explain the APIs in this step
jnp.sum(x, axis=...): Adds JAX array values along the selected axis.jax.jit(fn) / @jax.jit: Traces a function for its input signatures and compiles it; changed shapes, dtypes, or static arguments can trigger another compilation.jax.device_put(x, device=...): Places or transfers an array to the requested device or sharding; dispatch is asynchronous.jax.block_until_ready(tree): Waits for asynchronous device work on every array in a PyTree to finish.
2 Record call signatures and observed traces
Append this block to the same file. Run the assembled file with python diagnosis.py.
# Step 2 — Record call signatures and observed traces
call_rows = []
def observed_call(label, x, gain):
    before = len(trace_events)
    # Place `result` explicitly onto the target JAX device.
    result = compiled_score(x, jax.device_put(np.float32(gain), cpu))
    # Wait for device work to finish before timing it or comparing its result on the host.
    result.block_until_ready()
    # Transfer the device result to the host for an independent NumPy comparison.
    expected = np.sum((np.asarray(x) * np.float32(gain))**2)
    # Transfer the device result to the host for an independent NumPy comparison.
    np.testing.assert_allclose(np.asarray(result), expected, rtol=2e-5, atol=2e-5)
    call_rows.append({"label": label, "shape": list(x.shape), "dtype": str(x.dtype),
                      "observed_trace_delta": len(trace_events) - before,
                      "result": float(result)})
    return result
The ledger relates each controlled signature change to the observed Python event delta, with an independent NumPy value check.
Explain the APIs in this step
jax.device_put(x, device=...): Places or transfers an array to the requested device or sharding; dispatch is asynchronous.output.block_until_ready(): Waits for asynchronous device work on this array to finish, which is needed before measuring completed computation time.np.testing.assert_allclose(actual, desired, rtol=..., atol=...): Checks a host-side numerical expectation and raisesAssertionErrorwhen values differ beyond tolerance.
3 Run the controlled call sequence
Append this block to the same file. Run the assembled file with python diagnosis.py.
# Step 3 — Run the controlled call sequence: Inspect the event deltas on your own environment.
observed_call("initial signature", x8, 1.)
observed_call("same signature changed data", x8 + 1., 1.)
observed_call("same signature changed dynamic gain", x8, 2.)
observed_call("different input shape", x12, 1.)
print(json.dumps({"jax": jax.__version__, "backend": str(cpu),
                  "calls": call_rows, "python_trace_events": trace_events}, indent=2))
assert call_rows[0]["result"] == 140.
assert call_rows[2]["result"] == 560.
assert call_rows[3]["result"] == 506.
Inspect the event deltas on your own environment. The required outputs are checked numeric scores, not a fabricated trace or compilation count.
View the cumulative build in main.py
These blocks append in order to your separate practice file.
# Step 1 — Prepare a trace ledger
import json
import time
import numpy as np
import jax
import jax.numpy as jnp
cpu = jax.devices("cpu")[0]
trace_events = []
def score(x, gain):
    # Authoring diagnostic: this Python effect happens during tracing.
    # It is NOT model state and does not count executable compilations.
    trace_events.append({"shape": list(x.shape), "dtype": str(x.dtype)})
    return jnp.sum((x * gain)**2)
# Wrap with `jax.jit` (`compiled_score`) so XLA traces and compiles the function.
compiled_score = jax.jit(score)
x8 = jax.device_put(np.arange(8, dtype=np.float32), cpu)
x12 = jax.device_put(np.arange(12, dtype=np.float32), cpu)
# Wait for device work to finish before timing it or comparing its result on the host.
jax.block_until_ready((x8, x12))

# Step 2 — Record call signatures and observed traces
call_rows = []
def observed_call(label, x, gain):
    before = len(trace_events)
    # Place `result` explicitly onto the target JAX device.
    result = compiled_score(x, jax.device_put(np.float32(gain), cpu))
    # Wait for device work to finish before timing it or comparing its result on the host.
    result.block_until_ready()
    # Transfer the device result to the host for an independent NumPy comparison.
    expected = np.sum((np.asarray(x) * np.float32(gain))**2)
    # Transfer the device result to the host for an independent NumPy comparison.
    np.testing.assert_allclose(np.asarray(result), expected, rtol=2e-5, atol=2e-5)
    call_rows.append({"label": label, "shape": list(x.shape), "dtype": str(x.dtype),
                      "observed_trace_delta": len(trace_events) - before,
                      "result": float(result)})
    return result

# Step 3 — Run the controlled call sequence: Inspect the event deltas on your own environment.
observed_call("initial signature", x8, 1.)
observed_call("same signature changed data", x8 + 1., 1.)
observed_call("same signature changed dynamic gain", x8, 2.)
observed_call("different input shape", x12, 1.)
print(json.dumps({"jax": jax.__version__, "backend": str(cpu),
                  "calls": call_rows, "python_trace_events": trace_events}, indent=2))
assert call_rows[0]["result"] == 140.
assert call_rows[2]["result"] == 560.
assert call_rows[3]["result"] == 506.
Run the example
python3 phases/08-performance/02-diagnose-recompilation-and-host-synchronization/code/main.pyAbout this command
This shortcut uses an activated macOS/Linux course environment in the repository folder. For Windows, use the explicit interpreter command in “Setup help” above. The script includes worked examples and reference solutions.
Inspect the complete assembled example
# Step 1 — Prepare a trace ledger
import json
import time
import numpy as np
import jax
import jax.numpy as jnp
cpu = jax.devices("cpu")[0]
trace_events = []
def score(x, gain):
    # Authoring diagnostic: this Python effect happens during tracing.
    # It is NOT model state and does not count executable compilations.
    trace_events.append({"shape": list(x.shape), "dtype": str(x.dtype)})
    return jnp.sum((x * gain)**2)
# Wrap with `jax.jit` (`compiled_score`) so XLA traces and compiles the function.
compiled_score = jax.jit(score)
x8 = jax.device_put(np.arange(8, dtype=np.float32), cpu)
x12 = jax.device_put(np.arange(12, dtype=np.float32), cpu)
# Wait for device work to finish before timing it or comparing its result on the host.
jax.block_until_ready((x8, x12))
# Step 2 — Record call signatures and observed traces
call_rows = []
def observed_call(label, x, gain):
    before = len(trace_events)
    # Place `result` explicitly onto the target JAX device.
    result = compiled_score(x, jax.device_put(np.float32(gain), cpu))
    # Wait for device work to finish before timing it or comparing its result on the host.
    result.block_until_ready()
    # Transfer the device result to the host for an independent NumPy comparison.
    expected = np.sum((np.asarray(x) * np.float32(gain))**2)
    # Transfer the device result to the host for an independent NumPy comparison.
    np.testing.assert_allclose(np.asarray(result), expected, rtol=2e-5, atol=2e-5)
    call_rows.append({"label": label, "shape": list(x.shape), "dtype": str(x.dtype),
                      "observed_trace_delta": len(trace_events) - before,
                      "result": float(result)})
    return result
# Step 3 — Run the controlled call sequence: Inspect the event deltas on your own environment.
observed_call("initial signature", x8, 1.)
observed_call("same signature changed data", x8 + 1., 1.)
observed_call("same signature changed dynamic gain", x8, 2.)
observed_call("different input shape", x12, 1.)
print(json.dumps({"jax": jax.__version__, "backend": str(cpu),
                  "calls": call_rows, "python_trace_events": trace_events}, indent=2))
assert call_rows[0]["result"] == 140.
assert call_rows[2]["result"] == 560.
assert call_rows[3]["result"] == 506.
Expected result: A JSON ledger of four calls and observed Python trace events. Checked scores include , and ; event deltas are recorded rather than fixed by the lesson.
Recorded output and runtime details
Reference output captured from executing the complete lesson script (code/main.py) and its assertions in the course CPU environment.
{
  "jax": "0.9.2",
  "backend": "TFRT_CPU_0",
  "calls": [
    {
      "label": "initial signature",
      "shape": [
        8
      ],
      "dtype": "float32",
      "observed_trace_delta": 1,
      "result": 140.0
    },
    {
      "label": "same signature changed data",
      "shape": [
        8
      ],
      "dtype": "float32",
      "observed_trace_delta": 0,
      "result": 204.0
    },
    {
      "label": "same signature changed dynamic gain",
      "shape": [
        8
      ],
      "dtype": "float32",
      "observed_trace_delta": 0,
      "result": 560.0
    },
    {
      "label": "different input shape",
      "shape": [
        12
      ],
      "dtype": "float32",
      "observed_trace_delta": 1,
      "result": 506.0
    }
  ],
  "python_trace_events": [
    {
      "shape": [
        8
      ],
      "dtype": "float32"
    },
    {
      "shape": [
        12
      ],
      "dtype": "float32"
    }
  ]
}
{
  "jax": "0.9.2",
  "backend": "TFRT_CPU_0",
  "calls": [
    {
      "label": "initial signature",
      "shape": [
        8
      ],
      "dtype": "float32",
      "observed_trace_delta": 1,
      "result": 140.0
    },
    {
      "label": "same signature changed data",
      "shape": [
        8
      ],
      "dtype": "float32",
      "observed_trace_delta": 0,
      "result": 204.0
    },
    {
      "label": "same signature changed dynamic gain",
      "shape": [
        8
      ],
      "dtype": "float32",
      "observed_trace_delta": 0,
      "result": 560.0
    },
    {
      "label": "different input shape",
      "shape": [
        12
      ],
      "dtype": "float32",
      "observed_trace_delta": 1,
      "result": 506.0
    }
  ],
  "python_trace_events": [
    {
      "shape": [
        8
      ],
      "dtype": "float32"
    },
    {
      "shape": [
        12
      ],
      "dtype": "float32"
    }
  ]
}
Static branch trace observations: [{'shape': [8], 'square': True}, {'shape': [8], 'square': False}]
Per-step host reads seconds: 0.00010458333417773247
Final-only wait seconds: 3.0084047466516495e-05
Added ledger row: {'label': 'new length sixteen', 'shape': [16], 'dtype': 'float32', 'observed_trace_delta': 1, 'result': 1240.0}
Masked versus unmasked padded objective: 55.0 58.0
Observed runtime-Python-branch tracing failure
PASS: performance-02
Download execution record · The notebook includes executed cells and figure outputs. Compare your run with these values; timings depend on the machine.
Contrast static branch metadata with a dynamic gain
# Experiment — Contrast static branch metadata with a dynamic gain: The static Boolean controls Python program structure.
branch_events = []
def branch_score(x, square):
    branch_events.append({"shape": list(x.shape), "square": square})
    return jnp.sum(x**2) if square else jnp.sum(x)
# Wrap with `jax.jit` (`static_score`) so XLA traces and compiles the function.
static_score = jax.jit(branch_score, static_argnames=("square",))
for square in [True, True, False]:
    out = static_score(x8, square=square)
    # Transfer the device result to the host for an independent NumPy comparison.
    np.testing.assert_allclose(np.asarray(out), 140. if square else 28.)
print("Static branch trace observations:", branch_events)
Expected: Correct scores for both branches, plus the trace events observed in this process.
The static Boolean controls Python program structure. The earlier numerical gain was dynamic arithmetic data. These are distinct specialization choices; the printed diagnostic is not an executable compilation count.
Keep a metric on device until the reporting boundary
# Experiment — Keep a metric on device until the reporting boundary: The geometric-series result checks the computation independently.
# Wrap with `jax.jit` (`update`) so XLA traces and compiles the function.
update = jax.jit(lambda value: 0.9 * value + 1.)
# Place `initial` explicitly onto the target JAX device.
initial = jax.device_put(np.float32(0.), cpu)
# Wait for device work to finish before timing it or comparing its result on the host.
update(initial).block_until_ready()
def metric_run(read_each):
    value = initial
    observed = []
    start = time.perf_counter()
    for _ in range(6):
        value = update(value)
        if read_each:
            observed.append(float(value))
    # Wait for device work to finish before timing it or comparing its result on the host.
    value.block_until_ready()
    elapsed = time.perf_counter() - start
    return value, elapsed, observed
read_result, read_seconds, metrics = metric_run(True)
final_result, final_seconds, _ = metric_run(False)
reference_value = 10. * (1. - 0.9**6)
# Transfer the device result to the host for an independent NumPy comparison.
np.testing.assert_allclose(np.asarray(read_result), reference_value, rtol=2e-5)
# Transfer the device result to the host for an independent NumPy comparison.
np.testing.assert_allclose(np.asarray(final_result), reference_value, rtol=2e-5)
assert len(metrics) == 6
print("Per-step host reads seconds:", read_seconds)
print("Final-only wait seconds:", final_seconds)
Expected: Equivalent final values near and two measured intervals; no required speed ordering.
The geometric-series result checks the computation independently. Moving host consumption changes the measurement/observability boundary, so keep that difference beside both times.
Make it yours
Where to put your code: Modify your own main.py, or use the Make it yours cell in your downloaded notebook. Run your attempt in the declared environment and verify your prediction before opening the reference solution.
Add a call with sixteen float32 elements. Calculate its expected score independently and extend the signature ledger without labeling a trace event as a compilation.
Show a writing guide and starter scaffold
How to write this exercise code
Learner-only inputs, outputs, checks and hints
Inputs
- The existing specialization ledger, a 16-element float32 input, and the observed-call helper.
Outputs
- An independently checked score for the 16-element call and a new ledger row with its signature and trace observation.
Invariants to check
- The changed input shape adds a signature entry; a Python trace event is not labeled as proof of compilation.
Hints
- Calculate the sum of squared scaled elements on the host independently.
- Record shape, dtype, and trace delta as separate observations.
import numpy as np

def add_sixteen_element_call(ledger, values, gain, observed_call):
    # TODO: Run the new 16-element signature, verify its score independently, and append its observed ledger row.
    raise NotImplementedError
Reveal the reference solution
# Exercise solution: Add a call with sixteen float32 elements.
x16 = jax.device_put(np.arange(16, dtype=np.float32), cpu)
observed_call("new length sixteen", x16, 1.)
assert call_rows[-1]["result"] == sum(i*i for i in range(16))
print("Added ledger row:", call_rows[-1])
Pad a final batch while preserving the objective
Transfer
A final batch has five values while other batches have eight. Pad to eight and use an explicit validity mask in a dynamic array. Compare the masked sum of squares to an ordinary five-value calculation. Explain why padding without masking changes objectives with offsets.
Show a writing guide and starter scaffold
How to write this practice solution
Learner-only inputs, outputs, checks and hints
Inputs
- A final batch has five values while other batches have eight. Pad to eight and use an explicit validity mask in a dynamic array. Compare the masked sum of squares to an ordinary five-value calculation. Explain why padding without masking changes objectives with offsets.
Outputs
- Equal masked/unpadded objectives plus a counterexample without masking.
Invariants to check
- Padded entries contribute neither residual nor offset terms.
Hints
- Use a fixed-size input and mask; compute the offset transformation before masking.
import jax.numpy as jnp
import time

def practice_pad_a_final_batch_while_preserving_the_objective(values, valid_mask):
    """Implement the pad a final batch while preserving the objective check."""
    # TODO: Pad five values to eight with a validity mask and compare masked squared-error sum with the unpadded calculation.
    raise NotImplementedError
Show a hint
Use a fixed-size input and mask; compute the offset transformation before masking.
Reveal reference solution and reasoning
# Pad a final batch while preserving the objective (Transfer): The mask removes three synthetic rows.
# Wrap with `jax.jit` (`masked_score`) so XLA traces and compiles the function.
masked_score = jax.jit(lambda values, mask: jnp.sum(jnp.where(mask, (values + 1.)**2, 0.)))
five = np.arange(5, dtype=np.float32)
# Place `padded` explicitly onto the target JAX device.
padded = jax.device_put(np.pad(five, (0, 3)), cpu)
mask = jax.device_put(np.arange(8) < 5, cpu)
masked = masked_score(padded, mask)
# Transfer the device result to the host for an independent NumPy comparison.
np.testing.assert_allclose(np.asarray(masked), sum((i+1)**2 for i in range(5)))
wrong = jnp.sum((padded + 1.)**2)
assert float(wrong) == float(masked) + 3.
print("Masked versus unmasked padded objective:", float(masked), float(wrong))
The mask removes three synthetic rows. Zero padding alone adds three ones after the offset, so a fixed shape is useful only if it retains the original mathematical objective.
Reproduce and repair runtime Python branching
Diagnosis
Write a jitted function using if gain > on a scalar array. Capture its tracing failure and replace the branch with lax.cond. Verify both branches against independent arithmetic.
Show a writing guide and starter scaffold
How to write this practice solution
Learner-only inputs, outputs, checks and hints
Inputs
- Write a jitted function using if gain > on a scalar array. Capture its tracing failure and replace the branch with lax.cond. Verify both branches against independent arithmetic.
Outputs
- Captured tracing failure and correct outputs for both predicate outcomes.
Invariants to check
- The branch predicate is a scalar JAX value and both branches return matching result types.
Hints
- A runtime scalar predicate is a tracer, so Python cannot decide its truth value during tracing.
import jax
import jax.numpy as jnp
import time

def practice_reproduce_and_repair_runtime_python_branching(value, threshold):
    """Implement the reproduce and repair runtime python branching check."""
    # TODO: Trigger the traced scalar-array branch failure, then replace it with lax.cond and verify both branches against arithmetic.
    raise NotImplementedError
Show a hint
A runtime scalar predicate is a tracer, so Python cannot decide its truth value during tracing.
Reveal reference solution and reasoning
# Reproduce and repair runtime Python branching (Diagnosis)
def broken_branch(values, gain):
    if gain > 1.:
        return jnp.sum(values**2)
    return jnp.sum(values)
try:
    jax.jit(broken_branch)(x8, jax.device_put(np.float32(2.), cpu))
except jax.errors.TracerBoolConversionError:
    print("Observed runtime-Python-branch tracing failure")
else:
    raise AssertionError("runtime branch unexpectedly accepted")
# Wrap with `jax.jit` (`repaired`) so XLA traces and compiles the function.
repaired = jax.jit(lambda values, gain: jax.lax.cond(gain > 1., lambda v:jnp.sum(v**2), lambda v:jnp.sum(v), values))
for gain, expected in [(0.5, 28.), (2., 140.)]:
    # Place `result` explicitly onto the target JAX device.
    result = repaired(x8, jax.device_put(np.float32(gain), cpu))
    # Transfer the device result to the host for an independent NumPy comparison.
    np.testing.assert_allclose(np.asarray(result), expected)
The failure identifies a mismatch between Python control flow and runtime numerical data. lax.cond preserves a dynamic choice; declaring gain static would choose a different specialization contract instead.
Diagnose the result
If pauses correlate with varying batch lengths, record their signatures and check an explicitly masked fixed-size alternative. If host reads appear inside every update, first specify the reporting boundary and verify numerical equivalence before comparing synchronized observations.
Carry forward
- Record observed staging diagnostics without inventing compilation counts.
- Static metadata changes program specialization; ordinary arithmetic values can remain dynamic.
- Padding needs an objective-preserving mask.
- Host metrics provide useful observability and introduce completion boundaries.
Keep your evidence
Keep the controlled call ledger, actual trace observations labeled as traces, static/dynamic explanation, observed host-consumption intervals, masked-versus-unmasked counterexample and reproduced/repaired tracing failure.
Save your modified code, its output, and an explanation of your prediction. Checkpoint answers and exercise evidence are tracked separately.
Saved in this browser. Export or back up your portfolio anytime in My learning.
Reference execution: CPU validation only. This reference explicitly selects CPU. Uploading the same file or setting JAX_PLATFORMS does not adapt it to TPU. Use the execution matrix to review device selection and data ownership before adapting a separate target program. Execution matrix and target qualification.