 JAX Pathways
Phase 08 / Performance diagnosis
Read an XProf trace
Revision v0.7.0 · Updated since your last visit. Review the changes; your progress is saved.
Lesson · about 100 minutes · CPU practice
Capture an actual warmed CPU trace with named steps. Identify nested intervals and avoid double-counting their durations.
Phase study guide: preparation, milestones and project evidence
Before you start
Before this: Diagnose recompilation and host synchronization
Hardware: CPU
Setup help: Python, notebook, or Cloud TPU VM
Use the tested CPU packages (the recorded environment uses Python 3.14.3). Other Python versions and accelerator environments require separate checks. The optional Cloud TPU specialization explains the target-specific execution boundaries. Logical CPU devices practice partitioning; they do not simulate TPU performance.
Download the repository ZIP or use your existing checkout. Extract it and open a terminal in the folder containing requirements-cpu.txt. The beginner ZIP is separate; these lessons use the full repository folder.
python3 -m venv .venv
source .venv/bin/activate
python -m pip install -r requirements-cpu.txtpy -3 -m venv .venv
.\.venv\Scripts\python.exe -m pip install -r requirements-cpu.txtAfter activation, run the complete worked example from that same folder:
python phases/08-performance/03-read-an-xprof-trace/code/main.py.\.venv\Scripts\python.exe phases/08-performance/03-read-an-xprof-trace/code/main.pyFor an incremental build, create main.py in your own practice folder, append each build block in order, and run python main.py with this environment active. Keep that file separate from the downloaded reference solution.
Download this lesson’s notebook. Open it with a Python kernel using the course environment. Run cells from the top after restarting the kernel; experiments depend on earlier definitions.
For local Jupyter, first install the course requirements using the Local Python steps, then use your environment’s Python to start Jupyter:
python -m pip install jupyterlab
python -m jupyter lab.\.venv\Scripts\python.exe -m pip install jupyterlab
.\.venv\Scripts\python.exe -m jupyter labSelect the downloaded performance-03.ipynb file in JupyterLab. The notebook contains reference solutions; make your prediction and attempt each practice task before opening them. Restart the kernel before changing logical device setup.
The worked reference for this lesson is CPU-validated. Some references explicitly configure logical CPU devices; setting JAX_PLATFORMS does not adapt them to a TPU. Follow the execution matrix and reviewed multi-host example before attempting a target run.
For accelerator preparation, study TPU setup, observed runtime receipts, checkpointed jobs and precision and retained traces. These target paths remain unqualified on physical TPU hardware until an actual receipt is recorded. Cloud provisioning is optional for CPU learning.
Check: A real trace directory, four input-wait intervals, four model-and-wait intervals and four step intervals in microseconds. Values vary by run and include profiler overhead.
Revisit the guided CPU setup · Open 19: TPU Setup. Package instructions are CPU instructions; Windows and accelerator environments need their own validation.
What you will be able to do
- Capture an actual warmed CPU trace with named steps.
- Identify nested intervals and avoid double-counting their durations.
- Separate an injected host wait from a completed model call.
- Explain how to inspect the trace in XProf and bound a bottleneck claim.
The problem
Your timer says a training step is slow, but it cannot show whether the time was spent waiting for input or computing. We will capture a real JAX trace, add names that match the code, and read four steps from the recorded events before proposing an optimization.
The idea
A trace places events on a shared timeline so we can inspect order, waiting and overlap. Begin with a specific question about a slow step and identify which recorded events can answer it. Host annotations and device operations are different evidence.
Do not add nested durations twice
An outer step lasting milliseconds can contain a preprocessing region lasting milliseconds. Their sum is not milliseconds of elapsed work: the smaller region is already inside the larger one.
Inspect event starts, ends, nesting and lanes before aggregating durations. A gap may be waiting or uninstrumented work; it needs context before being assigned a cause.
The host-region plot summarizes recorded annotations, not GPU kernel execution. State a hypothesis, change one workload component and collect a comparable trace. A useful explanation predicts which interval changes and why, rather than only celebrating a shorter bar.
Give the timeline a question
We want to know where this particular step spends time. Input creation and compilation happen before tracing. Each recorded step then contains an explicitly injected host sleep and a compiled model call that waits for its output. The sleep is a controlled stand-in for a stalled input stage; it is not a measurement of Grain, network storage or a real dataset.
Before running, predict which named interval should contain the wait. If the annotation surrounds the wrong code, a polished timeline will answer the wrong question. Keep the code region and annotation name together.
Capture warmed work without hiding completion
Warm the exact shape and dtype before the trace. A model annotation ends after block_until_ready, so it includes host dispatch and waiting for the requested result. Without that wait, the host region might end while device work remains queued.
The four step annotations surround both inner regions. We check that each inner interval falls inside its step and that input wait precedes model execution. These temporal checks establish a relationship in the actual trace, not a simulated schedule.
Read a trace without adding the same time twice
An outer step includes its inner wait and model regions. Adding all three durations would double-count most of the step. Instead compare the inner intervals and calculate the remaining outer time as annotation and host overhead. Small timing rounding differences deserve an explicit tolerance; a large negative remainder means your events were not matched correctly.
The exported trace’s complete events express timestamps and durations in microseconds. Convert to seconds before comparing with a perf_counter report. An event lasting a thousand microseconds lasts one millisecond; a unit mistake can overwhelm any optimization effect.
Open the same evidence in XProf and on a TPU VM
The program prints the trace directory and retains the actual XPlane and Perfetto files there. To choose a durable folder, set JAX_COURSE_TRACE_DIR before running. Open the official XProf viewer in a compatible separately installed environment, select this log directory/profile, then open Trace Viewer and locate learner_step. Expand its host thread and inspect input_wait and model_and_wait.
Select one step and record its start, duration, enclosing thread and child intervals. When you run this lesson on a TPU VM provisioned with the workflow from lesson-welcome-03.html and tpu-gcp.html, set JAX_PLATFORMS=tpu and JAX_COURSE_TRACE_DIR=/tmp/tpu-trace, copy the trace directory back to your workstation with gcloud compute tpus tpu-vm scp --recurse, and inspect the TPU:0 device lanes alongside host submission; an empty host region does not prove an idle device. TODO (Cloud TPU Trace Extension): Capture a TPU XPlane trace on a Cloud TPU VM and compare the TPU:0 device lanes against this CPU trace.
Optional viewer in a separate compatible Python environment
# Run optional viewer in a separate compatible python environment using the course Python environment
python -m pip install xprof
xprof --port 8791 /absolute/path/to/your/trace-directory
Expected:
Replace the final path with the trace directory printed by the lesson. The viewer prints a local URL. Select the recorded run and trace_viewer. The viewer dependency and GUI are not covered by the course CPU receipt.
Capture the same trace on a Cloud TPU VM and copy it back for XProf
# Capture the same trace on a Cloud TPU VM and copy it back for XProf
gcloud compute tpus tpu-vm scp exercises/performance-03.py $TPU_NAME:~/jax-tpu-lab/ --zone=$ZONE
gcloud compute tpus tpu-vm ssh $TPU_NAME --zone=$ZONE \
  --command="JAX_PLATFORMS=tpu JAX_COURSE_TRACE_DIR=/tmp/tpu-trace ~/jax-tpu-lab/.venv/bin/python ~/jax-tpu-lab/performance-03.py"
gcloud compute tpus tpu-vm scp --recurse $TPU_NAME:/tmp/tpu-trace ./tpu-trace --zone=$ZONE
xprof --port 8791 ./tpu-trace
Expected:
Runs the trace capture on the TPU VM, copies the XPlane and Perfetto files back to ./tpu-trace on your workstation, and opens XProf so you can correlate host dispatch with TPU device execution lanes.
Make one change and repeat the same question
To investigate a real input bottleneck, replace the injected sleep with the actual input fetch while retaining the annotation boundary. Capture both versions under comparable load. Do not report a speedup from deleting a synthetic delay as if it optimized real model computation.
For compilation problems, capture a separate first-call trace and keep it labeled. Mixing cold and warm steps hides the distinction the previous lessons established. Small traces reduce observer overhead, but any profiler can perturb timings; confirm an improvement with an independent synchronized benchmark.
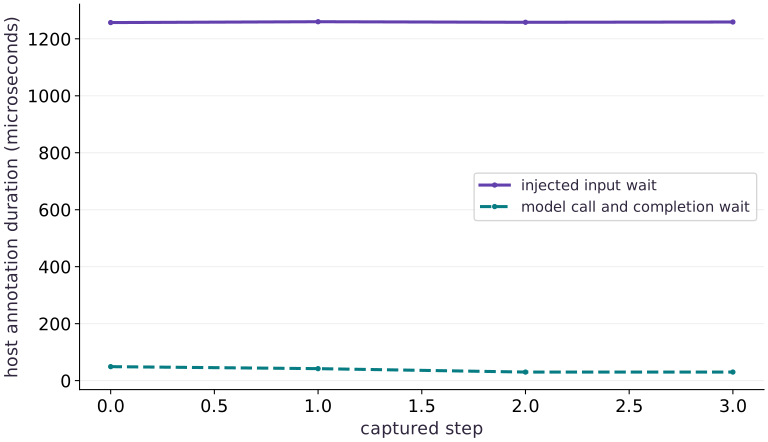
Where four annotated steps spent host time
Predict before looking: Which line should reflect the deliberately injected host wait?
Read the figure
The horizontal axis identifies the four captured steps. The vertical axis reports microseconds from actual trace events. The input-wait series contains a requested one-millisecond host sleep, so its duration should be interpreted around that scale with scheduler and profiler overhead; it is not a fixed measured constant.
The model-and-wait series covers dispatch through result readiness. Compare the numeric ticks and the recorded sample list to see which region takes longer in this run. Variation between steps can reflect scheduling or profiling overhead; it does not by itself demonstrate changing model work.
Connect it to the computation
Both plotted series are child regions within a learner_step annotation. They do not include warmup and they are not two isolated accelerator kernels. The code verifies their temporal order and checks the model output independently before interpreting the trace.
The outer step also contains small amounts of other host work. Do not add the outer duration to these inner durations, or call the injected sleep a measured production data stall. Replace the sleep with a real input fetch to investigate an actual pipeline.
Open full-size figureDownload data and provenance
The notebook contains the data experiment, plotting code, and recorded figure output. Rerun it to test your changes.
Where to put & run this code: Work in phases/08-performance/03-read-an-xprof-trace/code/main.py (or downloaded exercises/performance-03.py / exercises/performance-03.ipynb) and execute from the repository root with python3 phases/08-performance/03-read-an-xprof-trace/code/main.py.
1 Prepare a traceable workload
Create a Python file in the course environment. Add this block after the preceding block, then run the assembled file.
# Step 1 — Prepare a traceable workload: Inputs and compilation precede the measured steps.
import gzip
import json
import os
from pathlib import Path
import tempfile
import time
import numpy as np
import jax
import jax.numpy as jnp
# Read `trace_root` from environment configuration (with a default fallback).
trace_root=Path(os.environ.get('JAX_COURSE_TRACE_DIR') or tempfile.mkdtemp(prefix='jax-course-trace-')).resolve()
trace_root.mkdir(parents=True,exist_ok=True)
# Draw pseudorandom samples for `rng` using the explicit RNG state.
rng=np.random.default_rng(31)
host=rng.normal(size=(48,32)).astype(np.float32)
weights=rng.normal(size=(32,16)).astype(np.float32)
# Create device-backed JAX array `(x, w)`.
x,w=jnp.asarray(host),jnp.asarray(weights)
# Wrap with `jax.jit` (`compiled`) so XLA traces and compiles the function.
compiled=jax.jit(lambda a,b:jnp.tanh(a@b))
# Synchronize host execution until asynchronous device computation completes.
compiled(x,w).block_until_ready()
Code building blocks in this step
jax.jit(fn) / @jax.jit— Tracesfnwith abstract shapes and compiles a fused XLA executable cached by input shape and dtype.jax.block_until_ready(output)— Synchronizes with the accelerator/CPU device so asynchronous dispatch finishes before wall-clock timing.
Inputs and compilation precede the measured steps. The output remains independently checked against NumPy.
2 Capture named intervals
Create a Python file in the course environment. Add this block after the preceding block, then run the assembled file.
# Step 2 — Capture named intervals: The outer annotation provides context, while two nonoverlapping...
# Enter `jax.profiler.trace(trace_root, create_perfett` context block:
with jax.profiler.trace(trace_root,create_perfetto_trace=True):
    for index in range(4):
        with jax.profiler.StepTraceAnnotation('learner_step',step_num=index):
            with jax.profiler.TraceAnnotation('input_wait'):
                time.sleep(.001)  # injected host delay; not a measured real input pipeline
            with jax.profiler.TraceAnnotation('model_and_wait'):
                result=compiled(x,w)
                # Synchronize host execution until asynchronous device computation completes.
                result.block_until_ready()
np.testing.assert_allclose(result,np.tanh(host@weights),rtol=2e-5,atol=2e-5)
traces=sorted(trace_root.rglob('perfetto_trace.json.gz'),key=lambda p:p.stat().st_mtime_ns)
assert traces and list(trace_root.rglob('*.xplane.pb'))
events=json.loads(gzip.decompress(traces[-1].read_bytes()))['traceEvents']
def complete(name):
    return sorted([e for e in events if e.get('ph')=='X' and e.get('name')==name],key=lambda e:e['ts'])
steps=complete('learner_step')
input_events=complete('input_wait')
model_events=complete('model_and_wait')
assert len(steps)==len(input_events)==len(model_events)==4
for outer,waiting,compute in zip(steps,input_events,model_events):
    for inner in (waiting,compute):
        assert outer['ts']<=inner['ts']<=inner['ts']+inner['dur']<=outer['ts']+outer['dur']+1
    assert waiting['ts']+waiting['dur']<=compute['ts']+1
input_us=[e['dur'] for e in input_events]
model_us=[e['dur'] for e in model_events]
step_us=[e['dur'] for e in steps]
assert all(t>=0 for t in input_us+model_us+step_us)
print('Trace directory:',trace_root)
print(json.dumps({'input_wait_us':input_us,'model_and_wait_us':model_us,'step_us':step_us},indent=2))
print('Four named steps verified; host annotations are not isolated device kernels.')
Code building blocks in this step
jnp.allclose(actual, expected, rtol=..., atol=...)— Checks that two arrays match elementwise within floating-point tolerance.jax.block_until_ready(output)— Synchronizes with the accelerator/CPU device so asynchronous dispatch finishes before wall-clock timing.
The outer annotation provides context, while two nonoverlapping child regions distinguish injected waiting from completed computation.
3 Step 3: Verify invariants on the completed state
Run the final shape and numerical assertions to confirm the state built in Steps 1 and 2.
step_us=[e['dur'] for e in steps]
assert all(t>=0 for t in input_us+model_us+step_us)
Code building blocks in this step
all(...)— Callallwith your updated parameters or inputs from this lesson's workspace.assert condition— Verify that the observed output shape, status, or numerical value satisfies the contract.
Checking these invariants confirms the computation is ready for the full worked experiment.
View the cumulative build in main.py
These blocks append in order to the same file.
# Step 1 — Prepare a traceable workload: Inputs and compilation precede the measured steps.
import gzip
import json
import os
from pathlib import Path
import tempfile
import time
import numpy as np
import jax
import jax.numpy as jnp
# Read `trace_root` from environment configuration (with a default fallback).
trace_root=Path(os.environ.get('JAX_COURSE_TRACE_DIR') or tempfile.mkdtemp(prefix='jax-course-trace-')).resolve()
trace_root.mkdir(parents=True,exist_ok=True)
# Draw pseudorandom samples for `rng` using the explicit RNG state.
rng=np.random.default_rng(31)
host=rng.normal(size=(48,32)).astype(np.float32)
weights=rng.normal(size=(32,16)).astype(np.float32)
# Create device-backed JAX array `(x, w)`.
x,w=jnp.asarray(host),jnp.asarray(weights)
# Wrap with `jax.jit` (`compiled`) so XLA traces and compiles the function.
compiled=jax.jit(lambda a,b:jnp.tanh(a@b))
# Synchronize host execution until asynchronous device computation completes.
compiled(x,w).block_until_ready()

# Step 2 — Capture named intervals: The outer annotation provides context, while two nonoverlapping...
# Enter `jax.profiler.trace(trace_root, create_perfett` context block:
with jax.profiler.trace(trace_root,create_perfetto_trace=True):
    for index in range(4):
        with jax.profiler.StepTraceAnnotation('learner_step',step_num=index):
            with jax.profiler.TraceAnnotation('input_wait'):
                time.sleep(.001)  # injected host delay; not a measured real input pipeline
            with jax.profiler.TraceAnnotation('model_and_wait'):
                result=compiled(x,w)
                # Synchronize host execution until asynchronous device computation completes.
                result.block_until_ready()
np.testing.assert_allclose(result,np.tanh(host@weights),rtol=2e-5,atol=2e-5)
traces=sorted(trace_root.rglob('perfetto_trace.json.gz'),key=lambda p:p.stat().st_mtime_ns)
assert traces and list(trace_root.rglob('*.xplane.pb'))
events=json.loads(gzip.decompress(traces[-1].read_bytes()))['traceEvents']
def complete(name):
    return sorted([e for e in events if e.get('ph')=='X' and e.get('name')==name],key=lambda e:e['ts'])
steps=complete('learner_step')
input_events=complete('input_wait')
model_events=complete('model_and_wait')
assert len(steps)==len(input_events)==len(model_events)==4
for outer,waiting,compute in zip(steps,input_events,model_events):
    for inner in (waiting,compute):
        assert outer['ts']<=inner['ts']<=inner['ts']+inner['dur']<=outer['ts']+outer['dur']+1
    assert waiting['ts']+waiting['dur']<=compute['ts']+1
input_us=[e['dur'] for e in input_events]
model_us=[e['dur'] for e in model_events]
step_us=[e['dur'] for e in steps]
assert all(t>=0 for t in input_us+model_us+step_us)
print('Trace directory:',trace_root)
print(json.dumps({'input_wait_us':input_us,'model_and_wait_us':model_us,'step_us':step_us},indent=2))
print('Four named steps verified; host annotations are not isolated device kernels.')

step_us=[e['dur'] for e in steps]
assert all(t>=0 for t in input_us+model_us+step_us)
Run the example
python3 phases/08-performance/03-read-an-xprof-trace/code/main.pyAbout this command
This shortcut uses an activated macOS/Linux course environment in the repository folder. For Windows, use the explicit interpreter command in “Setup help” above. The script includes worked examples and reference solutions.
Inspect the complete assembled example
# Step 1 — Prepare a traceable workload: Inputs and compilation precede the measured steps.
import gzip
import json
import os
from pathlib import Path
import tempfile
import time
import numpy as np
import jax
import jax.numpy as jnp
# Read `trace_root` from environment configuration (with a default fallback).
trace_root=Path(os.environ.get('JAX_COURSE_TRACE_DIR') or tempfile.mkdtemp(prefix='jax-course-trace-')).resolve()
trace_root.mkdir(parents=True,exist_ok=True)
# Draw pseudorandom samples for `rng` using the explicit RNG state.
rng=np.random.default_rng(31)
host=rng.normal(size=(48,32)).astype(np.float32)
weights=rng.normal(size=(32,16)).astype(np.float32)
# Create device-backed JAX array `(x, w)`.
x,w=jnp.asarray(host),jnp.asarray(weights)
# Wrap with `jax.jit` (`compiled`) so XLA traces and compiles the function.
compiled=jax.jit(lambda a,b:jnp.tanh(a@b))
# Synchronize host execution until asynchronous device computation completes.
compiled(x,w).block_until_ready()

# Step 2 — Capture named intervals: The outer annotation provides context, while two nonoverlapping...
# Enter `jax.profiler.trace(trace_root, create_perfett` context block:
with jax.profiler.trace(trace_root,create_perfetto_trace=True):
    for index in range(4):
        with jax.profiler.StepTraceAnnotation('learner_step',step_num=index):
            with jax.profiler.TraceAnnotation('input_wait'):
                time.sleep(.001)  # injected host delay; not a measured real input pipeline
            with jax.profiler.TraceAnnotation('model_and_wait'):
                result=compiled(x,w)
                # Synchronize host execution until asynchronous device computation completes.
                result.block_until_ready()
np.testing.assert_allclose(result,np.tanh(host@weights),rtol=2e-5,atol=2e-5)
traces=sorted(trace_root.rglob('perfetto_trace.json.gz'),key=lambda p:p.stat().st_mtime_ns)
assert traces and list(trace_root.rglob('*.xplane.pb'))
events=json.loads(gzip.decompress(traces[-1].read_bytes()))['traceEvents']
def complete(name):
    return sorted([e for e in events if e.get('ph')=='X' and e.get('name')==name],key=lambda e:e['ts'])
steps=complete('learner_step')
input_events=complete('input_wait')
model_events=complete('model_and_wait')
assert len(steps)==len(input_events)==len(model_events)==4
for outer,waiting,compute in zip(steps,input_events,model_events):
    for inner in (waiting,compute):
        assert outer['ts']<=inner['ts']<=inner['ts']+inner['dur']<=outer['ts']+outer['dur']+1
    assert waiting['ts']+waiting['dur']<=compute['ts']+1
input_us=[e['dur'] for e in input_events]
model_us=[e['dur'] for e in model_events]
step_us=[e['dur'] for e in steps]
assert all(t>=0 for t in input_us+model_us+step_us)
print('Trace directory:',trace_root)
print(json.dumps({'input_wait_us':input_us,'model_and_wait_us':model_us,'step_us':step_us},indent=2))
print('Four named steps verified; host annotations are not isolated device kernels.')
Expected result: A real trace directory, four input-wait intervals, four model-and-wait intervals and four step intervals in microseconds. Values vary by run and include profiler overhead.
Recorded reference execution
Reference output captured from executing the complete lesson script (code/main.py) and its assertions in the course CPU environment.
Trace directory: /private/var/folders/mp/_mq7srqx2y10p5nhjz9m7hj40000gn/T/jax-course-trace-l3tdro07
{
  "input_wait_us": [
    1263,
    1253,
    1269,
    1271
  ],
  "model_and_wait_us": [
    108,
    137,
    74,
    140
  ],
  "step_us": [
    1393,
    1406,
    1354,
    1423
  ]
}
Four named steps verified; host annotations are not isolated device kernels.
Trace directory: /private/var/folders/mp/_mq7srqx2y10p5nhjz9m7hj40000gn/T/jax-course-trace-g8x32sim
{
  "input_wait_us": [
    1263,
    1279,
    1265,
    1275
  ],
  "model_and_wait_us": [
    82,
    136,
    62,
    122
  ],
  "step_us": [
    1350,
    1429,
    1335,
    1407
  ]
}
Four named steps verified; host annotations are not isolated device kernels.
Unattributed outer time, microseconds: [5, 14, 8, 10]
Wrong double-counted totals: [2695, 2844, 2662, 2804]
{'minimum_ms': 0.062, 'median_ms': 0.10200000000000001, 'maximum_ms': 0.136}
Hypothetical union: 12 microseconds; summed duration: 19.
PASS: performance-03
Download execution record · The notebook includes executed cells and figure outputs. Compare your run with these values; timings depend on the machine.
Account for the enclosing step
# Experiment — Account for the enclosing step: Outer and child intervals describe nested boundaries.
overhead=np.asarray(step_us)-np.asarray(input_us)-np.asarray(model_us)
assert np.all(overhead>=-2)
# Convert `wrong` to a host NumPy array for inspection or verification.
wrong=np.asarray(step_us)+np.asarray(input_us)+np.asarray(model_us)
assert np.all(wrong>=np.asarray(step_us))
print('Unattributed outer time, microseconds:',overhead.tolist())
print('Wrong double-counted totals:',wrong.tolist())
Expected: The remainder is nonnegative within rounding; the double-counted totals exceed the step durations.
Outer and child intervals describe nested boundaries. The remainder is host/annotation work inside the step but outside its two children; it is not automatically device idle time.
Make it yours
Where to put your code: Append your solution at the bottom of phases/08-performance/03-read-an-xprof-trace/code/main.py (or inside the Make it yours cell of exercises/performance-03.ipynb) and run python3 phases/08-performance/03-read-an-xprof-trace/code/main.py to verify your prediction before opening the reference solution.
Convert every model interval to milliseconds and summarize its minimum, median and maximum. Keep the individual samples and explain why four observations is distinct from a tail-latency service guarantee.
Show a writing guide and starter scaffold
How to write this exercise code: step-by-step recipe & starter scaffold
1. Key functions & syntax to use:
jnp.allclose(actual, expected, rtol=..., atol=...)— Checks that two arrays match elementwise within floating-point tolerance.
2. Step-by-step implementation plan:
- Aggregate array values to compute
summary. - Execute
np.testing.assert_allclose(model_ms*1000,model_us)
# Exercise solution: Convert every model interval to milliseconds and summarize its...
model_ms = np.asarray(...)  # TODO: compute model_ms
# Aggregate array values to compute `summary`.
summary = ...  # TODO: compute summary
assert summary['minimum_ms']  # TODO: complete assertion check
# Execute `np.testing.assert_allclose(model_ms*1000,model_us)`
np.testing.assert_allclose(model_ms*1000,model_us)
print(summary)
Reveal the reference solution
# Exercise solution: Convert every model interval to milliseconds and summarize its...
model_ms=np.asarray(model_us)/1000
# Aggregate array values to compute `summary`.
summary={'minimum_ms':float(model_ms.min()),'median_ms':float(np.median(model_ms)),'maximum_ms':float(model_ms.max())}
assert summary['minimum_ms']<=summary['median_ms']<=summary['maximum_ms']
# Execute `np.testing.assert_allclose(model_ms*1000,model_us)`
np.testing.assert_allclose(model_ms*1000,model_us)
print(summary)
Compute a union instead of summing overlap
Transfer
For hypothetical intervals [0,10], [2,7] and [8,12] microseconds, calculate their union duration and compare with their summed durations. Explain why this matters for nested host events.
Show a writing guide and starter scaffold
How to write this practice solution: step-by-step recipe & starter scaffold
1. Key functions & syntax to use:
overlap(...)— Calloverlapwith your updated parameters or inputs from this lesson's workspace.union_duration(...)— Callunion_durationwith your updated parameters or inputs from this lesson's workspace.assert condition— Verify that the observed output shape, status, or numerical value satisfies the contract.
2. Step-by-step implementation plan:
- Guard input contract (
end < start) and fail fast if violated.
# Compute a union instead of summing overlap (Transfer): A union describes time covered by any interval.
def union_duration(intervals):
    total = ...  # TODO: compute total
    left = ...  # TODO: compute left
    for start,end in sorted(intervals):
        # Guard input contract (`end < start`) and fail fast if violated.
        if end<start:raise ValueError('negative interval')
        if right is None:left,right=start,end
        elif start<=right:right=max(right,end)
        else:
            total+=right-left
            left,right = ...  # TODO: compute left,right
    return ...  # TODO: return computed result
assert union_duration([(0,10),(2,7),(8,12)])  # TODO: complete assertion check
assert sum(b-a for a,b  # TODO: complete assertion check
print('Hypothetical union: 12 microseconds; summed duration: 19.')
Show a hint
Sort endpoints and merge intervals that intersect.
Reveal reference solution and reasoning
# Compute a union instead of summing overlap (Transfer): A union describes time covered by any interval.
def union_duration(intervals):
    total=0
    left=right=None
    for start,end in sorted(intervals):
        # Guard input contract (`end < start`) and fail fast if violated.
        if end<start:raise ValueError('negative interval')
        if right is None:left,right=start,end
        elif start<=right:right=max(right,end)
        else:
            total+=right-left
            left,right=start,end
    return total+(0 if right is None else right-left)
assert union_duration([(0,10),(2,7),(8,12)])==12
assert sum(b-a for a,b in [(0,10),(2,7),(8,12)])==19
print('Hypothetical union: 12 microseconds; summed duration: 19.')
A union describes time covered by any interval. A sum counts overlap repeatedly. Neither alone says which device was busy; lane and dependency information still matter.
Diagnose the result
If expected events are absent, verify that the trace scope surrounds execution, warmup is outside it, names match exactly, and the selected file belongs to the latest capture. If nested durations do not fit, inspect timestamps and thread IDs rather than adding unrelated lanes.
Carry forward
- Name trace regions for a concrete diagnostic question.
- Read units, threads and nesting before attributing time.
- Confirm trace-driven changes with an independent benchmark.
Keep your evidence
Keep the actual XPlane and Perfetto paths, named interval durations and nesting check, units and an interpretation separating injected input delay from completed computation.
Save your modified code, its output, and an explanation of your prediction. Checkpoint answers and exercise evidence are tracked separately.
Saved in this browser. Export or back up your portfolio anytime in My learning.
Verified on local CPU. Stage to a Cloud TPU VM via Cloud TPU setup to record accelerator execution receipts (TODO: add automated Cloud TPU CI execution receipts).